So, you’ve created a survey (or multiple surveys), convinced people to take part and answer your questions, and have received the results. Great job! Yet, the real test comes when it’s time to make sense of these survey findings.
Today, we’ll take a look at why you need surveys, how to design effective surveys, how to analyse survey data, how to analyse survey data with multiple responses, and how to do data harmonisation when you’re dealing with multiple surveys. After reading this article, you’ll be ready to make the most out of your survey results.
First of all, let’s talk about what you need surveys for. Tim Berners-Lee, inventor of the World Wide Web, once said: “Data is a precious thing and will last longer than the systems themselves.”
Surveys are a key tool for collecting this valuable data. They shed light on what people think, what they prefer, and the direction market trends are heading. They are your key to unlocking insights that:
It all depends on what your goals are and how you phrase the survey questions. But how do you make sure you’re asking the right questions…?
Setting clear research goals and objectives at the start is key to the success of your survey. It guarantees that every question you ask is steering you toward the answers you need, rather than leading you into a maze of irrelevant data.
When it comes to the data you’re gathering, there are two main types: qualitative and quantitative. Qualitative data is all about the “why” and “how”. It’s like listening to the stories of your respondents, which offer depth and insight into their experiences and opinions.
On the other hand, quantitative data deals with numbers. It answers questions like “how many” and “how often”, which provides a bird’s-eye view of patterns and trends.
Now, crafting your survey questions is an art form in itself. It’s about striking the right balance to avoid leading, ambiguous, or confusing wording.
Leading questions are like putting words in someone’s mouth – you’re more likely to get the answer you hinted at rather than their true opinion. An example would be crafting a survey question that states “Our service is outstanding, don’t you agree?”. It’s a bit like asking if the sky is blue on a sunny day. You’re leading the witness! Instead, try to phrase your questions neutrally to get honest feedback.
Ambiguous questions are those that leave respondents scratching their heads, thinking, “What exactly are you asking?” For example, including a question like “How do you find our website?” could leave respondents wondering whether they’re rating the design or if they’re supposed to explain how they landed on your page. Clarity is your best friend in survey design.
You also don’t want your questions to be overwhelming or confusing. Asking a respondent to rate their experience on a scale from 1-37 might seem like a good idea at 3 a.m., but in the light of day, it’s clear that simplicity is key. Stick to scales that don’t require a math degree to understand.
Here’s an interesting fact: Did you know that the average attention span is now just eight seconds, shorter than that of a goldfish? This means you need to design concise surveys and focus on what truly matters to get meaningful insights without overwhelming your audience.
When analysing the data from a single survey, you’re essentially looking at it in two ways: what the numbers tell you (quantitative analysis) and what the written answers from your respondents mean (qualitative analysis).
Think of quantitative analysis as simple math – you’re counting how many people picked one option over another, working out averages, or figuring out what percentage of your respondents like something. This approach helps you spot patterns. For example, if 80% of the people taking your survey say they prefer tea to coffee in the morning, that’s a clear trend. You can use excel or other tools to help you work out the numbers.
Qualitative analysis goes into the actual words people use in their responses. When people give feedback in their own words, you categorize their responses into themes – like how happy they are with your service or what they think could make your product better. This helps you understand the reasons behind the numbers.
When analysing survey data, it’s important to:
Questionnaire data analysis of a single survey is a bit like a puzzle. Each response, whether a number or a word, is a piece of the bigger picture. With careful analysis, you can reveal insights that can lead you to make informed decisions, enhance strategies, and improve your understanding of your audience.
Assessing data from two distinct surveys is a totally different game. Comparing different surveys can feel like aligning apples with oranges. Each may provide valuable insights, yet their differences in flavor and context cause unique challenges. These issues often arise from variations in the way questions are framed, the scales used for responses, or the demographics of those surveyed. Challenges might be caused by:
Such data discrepancies can obstruct the path to drawing precise comparisons or insights. For example, attempting to trace a trend by analysing two surveys conducted years apart without accounting for changes in question phrasing or respondent demographics may lead to skewed interpretations.
To accurately compare data from two surveys, you have to deal with these challenges with precision. You need to make sure that methodologies and demographic factors are as aligned as possible. But what do you do when you need to compare two entirely different surveys?
This is where data harmonisation comes in. It’s like translating different languages into one. This process aligns survey data and makes comparisons accurate and meaningful.
Data harmonisation is our solution to this problem. It’s like translating different languages into one common language, so we can understand and compare everything properly. This method makes sure that all the survey data matches up, which allows us to draw accurate and useful conclusions.
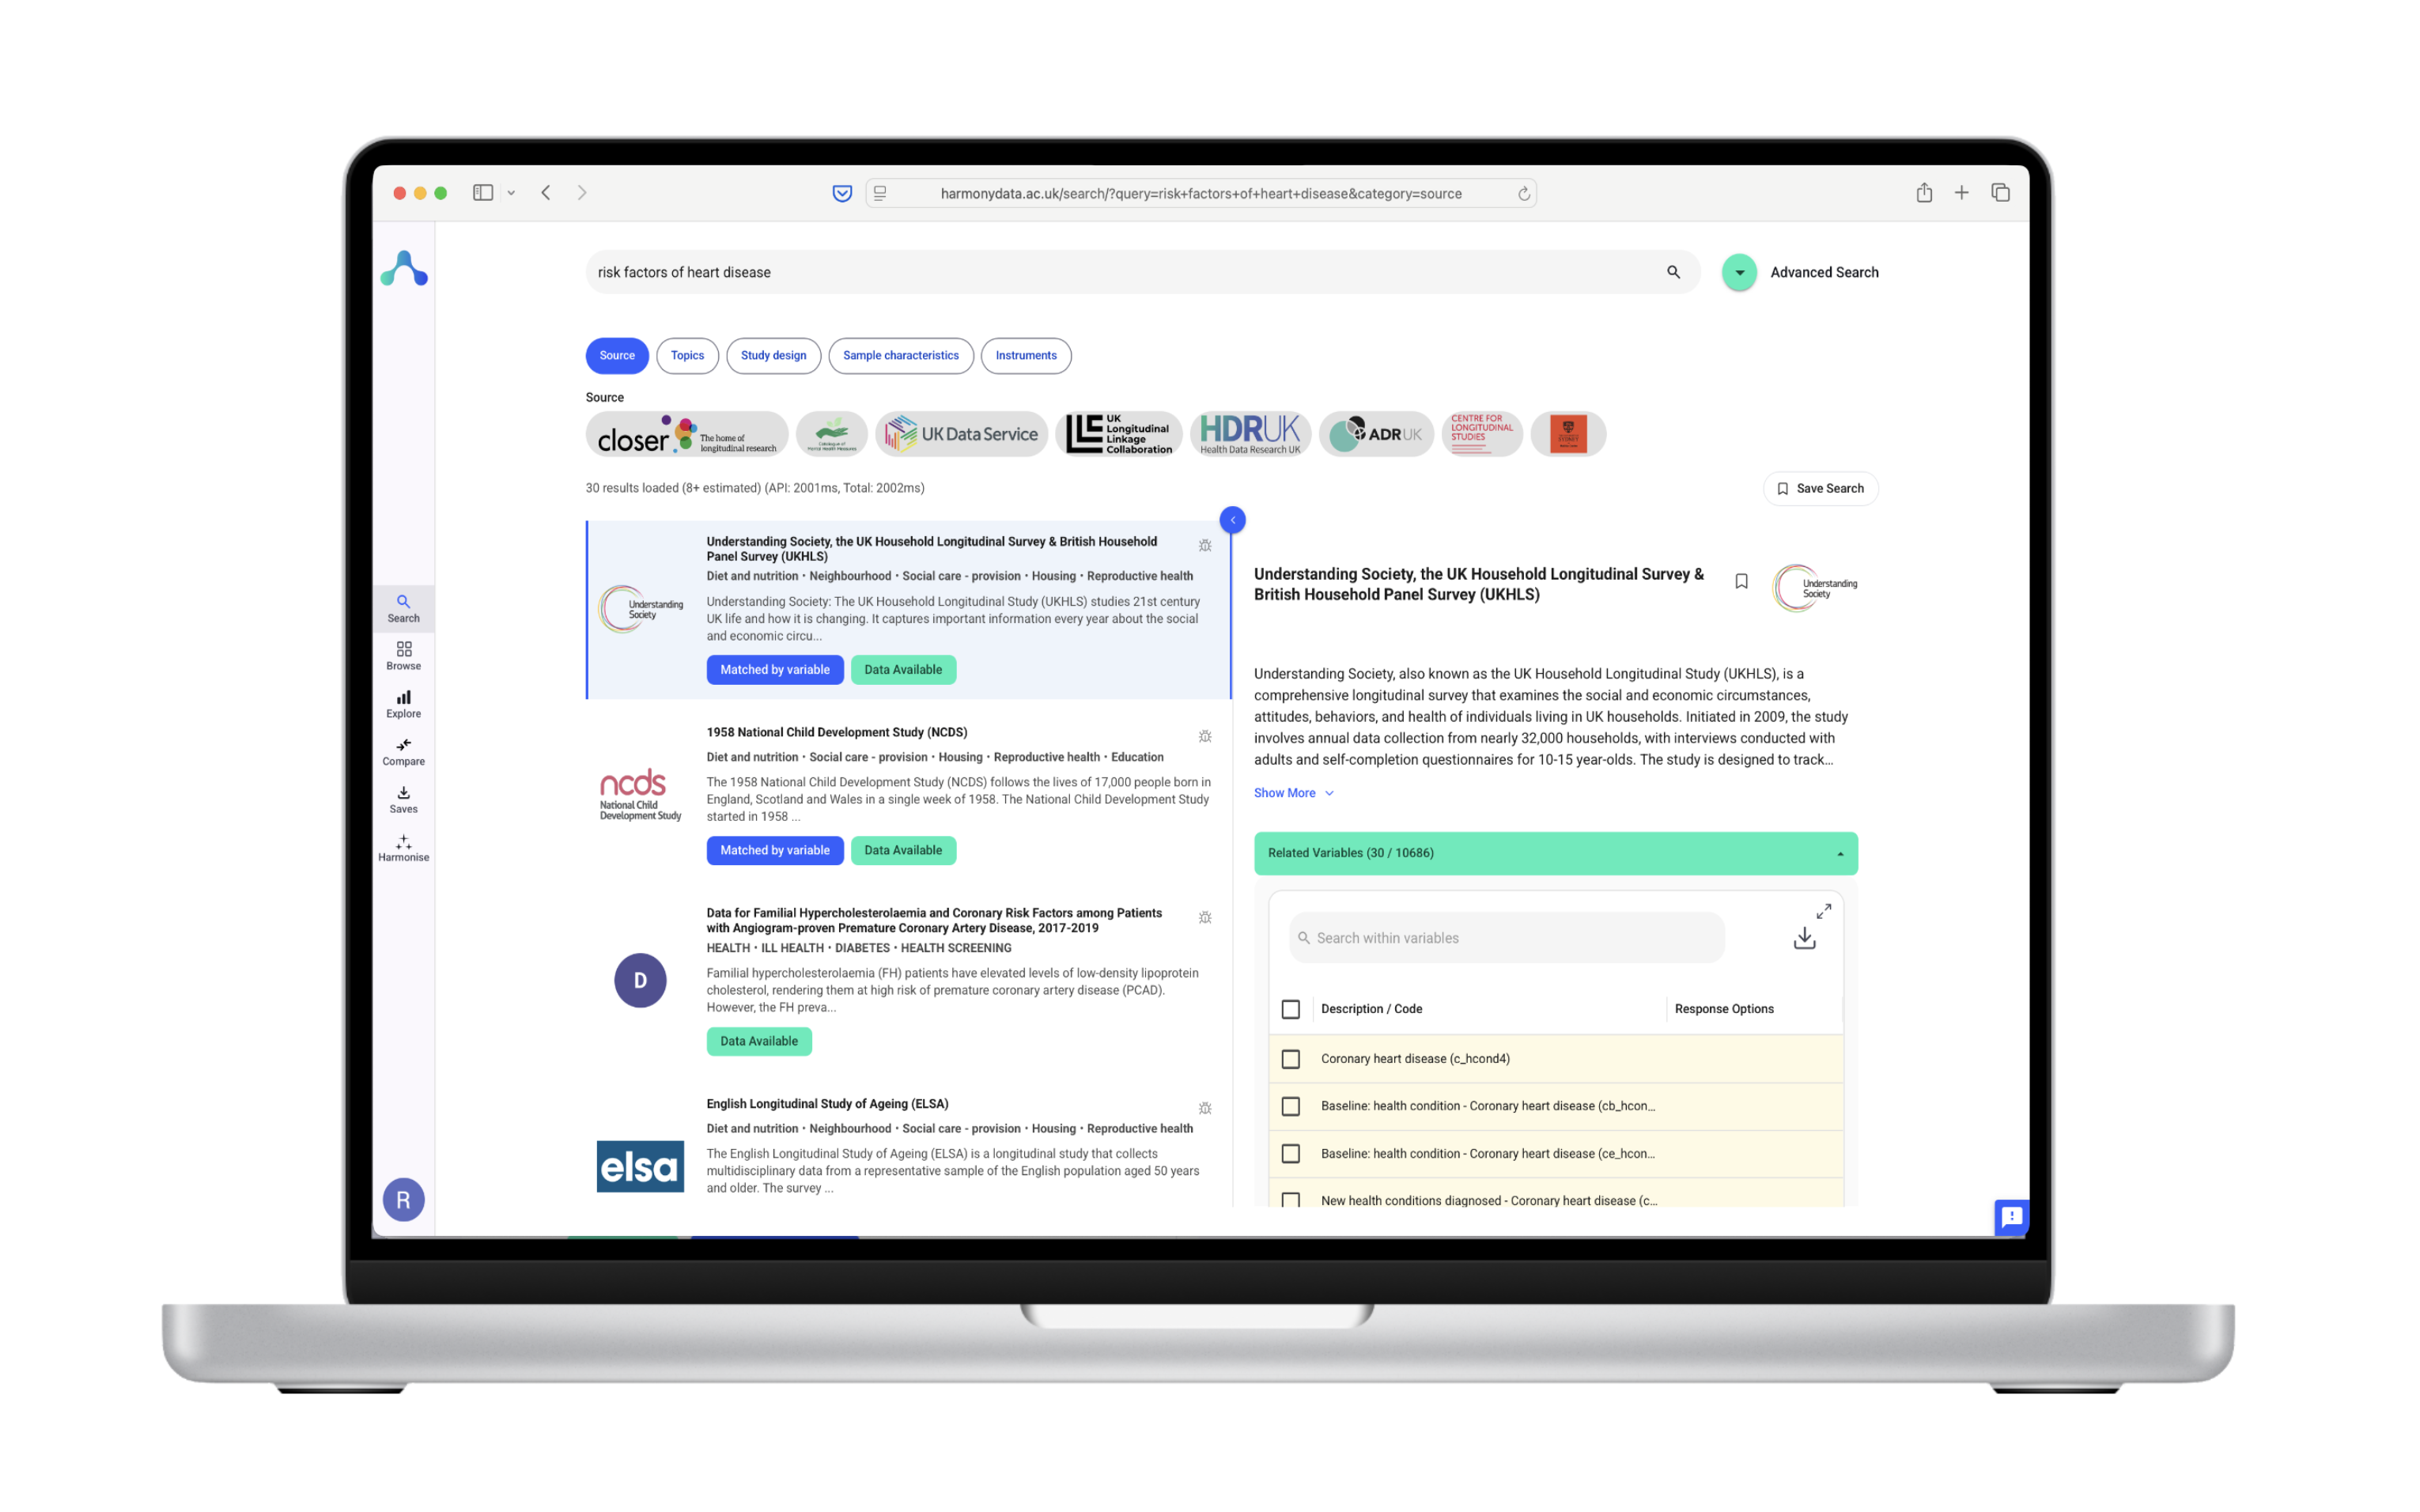
Harmony is a tool that makes the process of analysing survey results much easier – especially when you’re dealing with more than one survey. It’s designed to make sure different sets of data can be compared fairly and accurately.
Here’s how Harmony helps:
Harmony is all about making it easier to work with survey data. It takes away the headache of trying to figure out how to compare different surveys, letting you focus on what the data is telling you. This means better insights and smarter decisions based on clear, comparable data.
Using Harmony to analyse your survey data is straightforward, designed to make your analysis process as smooth as possible. Here’s how you can get started:
“Data is the new oil. It’s valuable, but if unrefined it cannot really be used. It has to be changed into gas, plastic, chemicals, etc. to create a valuable entity that drives profitable activity; so must data be broken down, analysed for it to have value.” – Clive Humby, UK Mathematician and Architect of Tesco’s Clubcard
Data-driven organisations are 23 times more likely to acquire customers. And turning survey data into useful insights is what smart questionnaire data analysis is all about.
The secret to these insights is effective data harmonisation, which makes sure data from various sources can stand side by side for analysis. Harmony provides an easy and accessible method to streamline your survey data.
No matter if your challenge is analysing one survey or comparing several, Harmony equips you with the necessary tools to fully utilize and benefit from your data.
We invite you to discover Harmony’s potential. Become part of a growing community that is benefiting from smart data harmonisation.
Meta Title: Mastering Survey Data Analysis with Harmony - A Smart Guide
Meta Description: Unlock the secrets of survey data with Harmony. Learn how to analyse and harmonise data for insightful decisions in our comprehensive guide.