When researchers take on the task of analysing data from surveys and questionnaires, they often encounter a significant obstacle: finding matching or common items across different sources. This challenge is due to the many different ways questions are asked or formatted. This makes it tough to compare and merge data effectively.
According to Forbes, researchers spend up to 80% of their time just getting data ready for analysis, and a big part of that time goes into harmonising data.
The harmonisation of questionnaire data, therefore, becomes an important aspect of research. This is especially true when you’re striving for high data accuracy and comparability (as you should).
Achieving a harmonised dataset means researchers can draw reliable connections and conclusions across different studies and this boosts the credibility and impact of their work. But how do you make it happen? Let’s talk about it!
Identifying the objectives behind harmonising questionnaire data is an important first step that shapes the entire harmonisation process. This involves pinpointing exactly what you hope to accomplish by finding matching or common items across various questionnaires. Your goals might vary, such as:
Understanding your research goals clearly is vital as it shapes your approach to harmonising data. It helps you identify the essential questions driving your research outcomes and decide which datasets deserve immediate attention. Additionally, it can reveal specific challenges, like aligning differently worded questions that aim to uncover the same information or managing diverse response scales.
Example: Imagine a researcher who wants to analyse dietary habits across different age groups to identify trends in healthy eating. Their objectives might include:
This initial step of defining your objectives not only makes the journey smoother but also guarantees that every effort you put in directly boosts the accuracy, relevance, and impact of your findings. Establishing clear goals from the get-go builds a solid groundwork for a harmonisation process that’s not just efficient but effective. By doing this, you open up paths to deeper and more significant insights from your questionnaire data.
Now that your objective is crystal clear, let’s move to step 2: identifying key themes. This step is just as important in finding matching items across different questionnaires.
How does it work? Well, this process often involves manually sifting through the data to spot common themes or similar questions.
There are two main strategies that can be used for effective organization and comparison: categorization and thematic analysis. Let’s take a look at both data harmonisation techniques and how they can be of help.
Begin by thoroughly examining each questionnaire and jotting down the principal topics or domains addressed by each query. Then, assign questions from different surveys to these identified themes. This organization helps you compare and align similar questions under unified themes.
For example, let’s say you have three different questionnaires on health and lifestyle. By categorising, you might find common themes such as “Dietary Habits,” “Physical Activity,” and “Mental Health.” Questions from each survey that ask about participants’ exercise routines can be grouped under “Physical Activity,” despite variations in wording or response options.
This technique goes deeper. Even if questions are phrased differently across surveys, they may still aim to collect data on a singular theme, like “Customer Satisfaction” or “Employee Engagement.” Thematic analysis enables you to cluster these questions together based on their informational goals, not just superficial similarity.
To visualize the process, imagine analysing surveys from different companies about workplace satisfaction. Despite different phrasings, you notice a recurring intent to measure “Work-Life Balance.” Questions like “How often do work demands interfere with your personal life?” and “Are you satisfied with your current work-life balance?” — though different — both seek insights on the same theme and can be analysed together.
Both these methods require a detailed review of the questionnaires and a deep understanding of the research objectives (step 1).
They also demand a level of subjectivity and judgement from the researcher, as deciding which questions are similar enough to be considered “matching” can sometimes be a nuanced decision.
When working with surveys and questionnaires, finding questions that match or are similar can be tough. This is because each survey might ask questions in different ways. To make this easier, some software tools can help. These data harmonisation tools look through the text to find questions that are either exactly the same or have a similar meaning.
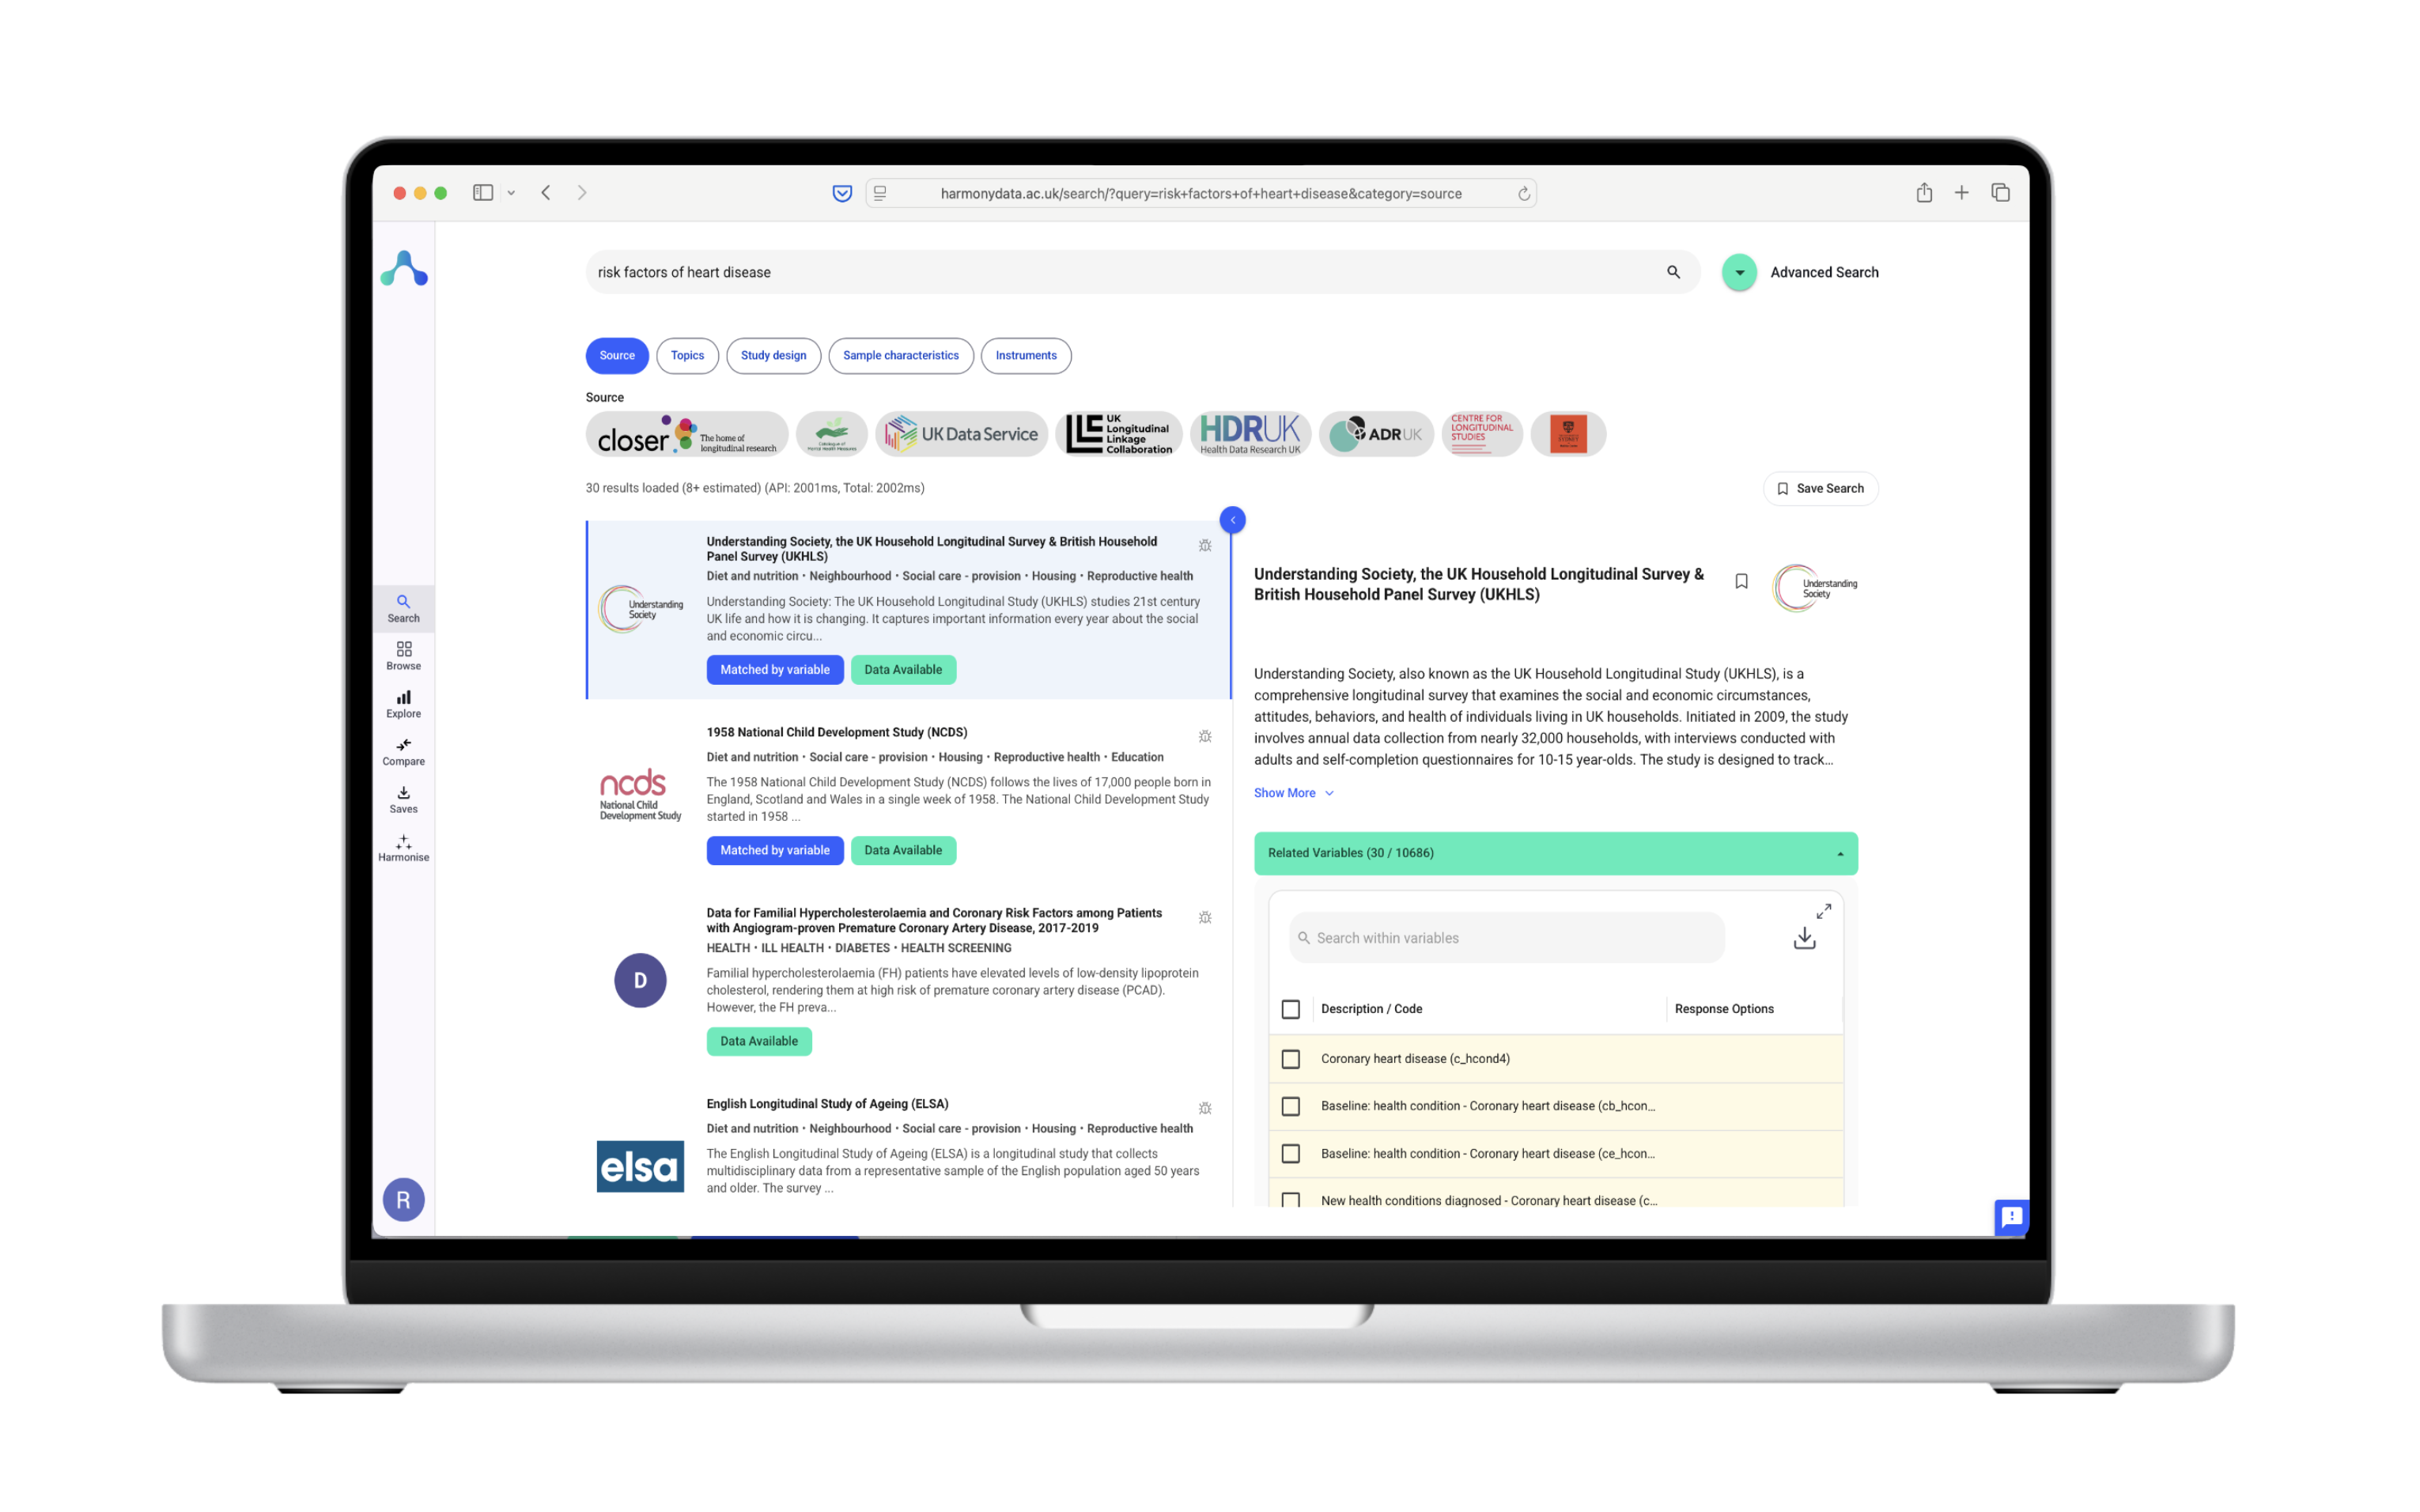
A great tool for this job is Harmony, our very own project. Harmony is special because it uses something called Natural Language Processing (NLP) to compare questions from different surveys. This is really useful if you’re working with surveys in more than one language or if you’ve got different versions of the same survey.
Harmony can check if questions are the same, kind of the same, or even opposites. It’s designed to make research easier by making sure you can compare data accurately, no matter where it comes from. You can use Harmony right from your web browser, or if you prefer coding, there’s a version for Python and R, too.
We’ve made Harmony with the idea that it should be easy for anyone to use, no matter if you’re a researcher at a university or someone working on your own project. We’re all about making your data work better for you and helping you to spot connections you might miss otherwise.
Whether you’re dealing with surveys in English, Portuguese, or any other language, Harmony is here to help you find those matching and common items quickly and accurately. It’s about making your data more reliable, so you can focus on what really matters in your research.
Clearly, finding ways to match up items from different sources is a significant challenge for researchers. The variety in how questions are asked can really complicate trying to line up and combine data. It shows just how important it is to have effective ways to harmonise data.
Achieving a high level of data accuracy and comparability is key, as it lets researchers draw solid connections and conclusions. It improves the quality and reliability of their findings, as you probably know very well. But do you know just how much of a problem unharmonised data poses? Well, a 2021 study in the Journal of Data Science pointed out that efforts to harmonise data could save the global research community millions of dollars every year by cutting down on unnecessary data gathering and making existing data sets more useful.
Using the right data harmonisation tools, having a thoughtful approach to survey design, and an openness to collaboration and learning from the research community are all equally vital. Researchers should:
The task of harmonising questionnaire data, though it can seem scary at first, is essential for elevating research outcomes. Let’s not view harmonised data as just a hurdle but as an opportunity to deepen our understanding of data and create more reliable and impactful research findings.
We know you might have some questions on your mind – either about our tool Harmony or about how to find matching and common items in questionnaires and surveys in general. We’ve got the answers:
Harmony uses advanced technology called Natural Language Processing (NLP) to understand and compare the text of survey questions. This tech allows Harmony to see not just the obvious matches but also to find questions that are similar in meaning. Think of it as having a really smart assistant who can read through thousands of questions and spot the ones that are asking the same thing, even if they’re worded differently.
To use Harmony for comparing and matching survey items is straightforward and easy. Here’s a simple guide:
1. First, you gather the surveys or questionnaires you want to compare.
2. Then, upload them to Harmony.
3. Harmony will analyse the text, compare the questions, and show you which ones match or are similar.
It’s a bit like doing a puzzle, but Harmony finds the matching pieces for you.
To analyse a survey, first, you need to collect all the answers. This means getting information from folks who filled it out, using online forms, paper sheets, or asking them directly. If you’re thinking, “How do you gather information from a survey?” the trick is to use a mix of these ways to make sure you don’t miss out on any useful feedback. After you’ve got all the data, sort it out. Look for patterns in the choices people made or dive into their written answers to see what they’re really saying. Using a tool like Harmony can make this much easier and help you spot what’s important quickly.
There are a few main ways to collect data with a questionnaire: online, on paper, or through an interview. Online questionnaires are quick and can reach lots of people fast. Paper ones are good for when you can’t use the internet. Interviews let you ask more questions based on what someone says. Each method helps make sure you get a full picture of what people think or feel about your questions.
Yes, Harmony can handle questionnaires in different languages! This is great for researchers working with data from various countries. By understanding the meaning behind the words, Harmony can match questions that are essentially the same but written in different languages. This feature opens up new possibilities for international research and makes it easier to compare studies from around the world.
Harmony is not just good with text. It can work with data in various formats, such as PDFs, Excel files, or online surveys. This means you can bring together all sorts of data sources and Harmony will help you make sense of them. Whether it’s a set of old questionnaires you have in PDF format or data collected through a modern survey platform, Harmony has you covered.
If you want to learn more or have a specific question, our website has lots of resources. You can check out our blog for the latest updates, watch info videos to see Harmony in action, or join our Discord community to talk with others using Harmony. We’re always here to help make your research journey smoother. Plus, by joining the community, you can share your experiences, get advice from other users, and even contribute to improving Harmony.
Meta Title: Harmonising Survey Data: Finding Common Items in Questionnaires
Meta Description: Discover strategies to harmonise survey data, using tools like Harmony for accurate analysis and comparison of questionnaires. Enhance research quality.
Keywords:

