Tabulating questionnaires and survey results is a crucial step in data analysis, providing insights into patterns, preferences, and trends among your respondents. This comprehensive guide will walk you through the process, from understanding basic concepts to applying these principles through a practical exercise. By the end, you will be equipped with the knowledge to efficiently organise, analyse, and interpret your survey data.
Tabulation involves organizing and summarizing data in a structured format, usually in tables, to facilitate analysis. This process is essential for interpreting survey results, as it converts raw data into a form that is easier to understand and analyse. Conducting surveys and questionnaires is a common practice in various fields such as market research, academic research, and social sciences. However, once the data is collected, it needs to be organised and analysed effectively to derive meaningful insights. Tabulating survey results is a crucial step in this process. In this article, we will explore the importance of tabulation, methods for tabulating data, and provide a practice exercise to reinforce your understanding.

Before tabulating your data, it’s crucial to understand the types of questions in your survey:
Survey data comes from questionnaires designed to gather information from specific groups of people about their opinions, behaviors, or characteristics. This data can be qualitative (non-numerical, text-based answers) or quantitative (numerical, measurable answers).

Tabulation transforms raw survey data into a summarised format, making it easier to analyse.
After basic tabulation, you may perform more sophisticated analyses, such as regression analysis, to explore relationships between variables, or factor analysis, to identify underlying factors in response patterns.
Now, Let’s start having some hands-on with each steps of the tabulation process.
Effective tabulation begins with well-designed questionnaires. Ensure questions are clear, concise, and relevant to your objectives. Decide in advance how you plan to tabulate and analyse responses, as this will influence question design (e.g., using Likert scales for attitudes, multiple choice for categorical data).
Before we dive into the practical exercise for preparing survey data for tabulation, let’s start by designing a questionnaire. For this exercise, we’ll use a sample mental health survey to gather information about individual’s mental well-being and coping mechanisms.
Demographic Information:
Mental Health Assessment:
Coping Mechanisms:
Additional Feedback:
Now, we have questions ready for collecting the raw data of the tabulations.
Before tabulating your data, it’s crucial to ensure it’s clean and organised. This involves several steps:
Data Cleaning: The first step in tabulating your survey results is data cleaning. This involves checking the data for errors, inconsistencies, and missing values. For closed-ended questions, ensure that all responses fall within the expected range. For open-ended questions, check for and correct typos or categorise responses if necessary.
Coding Open-ended Responses: For open-ended questions, you’ll need to code the responses. This means categorizing the answers into thematic groups or tags. For example, if you have a question about favorite fruits, you might categorise answers like “apple” and “banana” into a “fruits” category.
Setting Up Your Data Structure: Once your data is cleaned and coded, the next step is entering it into a spreadsheet or database. Each respondent should have their own row, and each question should have its own column. For closed-ended questions, you can enter the chosen option directly. For coded open-ended responses, enter the code or category you assigned.
Now, let’s proceed with preparing the data for tabulation based on the sample mental health survey. We’ll focus on cleaning the data and coding open-ended responses.
| Respondent ID | Age | Gender | Occupation | Overall Well-being | Diagnosed Disorder | Symptoms Frequency | Coping Mechanisms | Additional Feedback |
|---|---|---|---|---|---|---|---|---|
| 1 | 35 | Female | Teacher | 8 | Anxiety | Often | Exercise, Meditation | Overall, I feel more stressed during the workweek. |
| 2 | 42 | Male | Engineer | 7 | Depression | Sometimes | Therapy, Hobbies | No additional comments. |
| 3 | 28 | Non-binary | Student | 6 | None | Rarely | Socializing, Meditation | I find solace in nature. |
| 4 | 50 | Female | Nurse | 9 | None | Occasionally | Exercise, Therapy, Hobbies | I believe self-care is essential for mental well-being. |
| 5 | 39 | Male | Lawyer | 6 | Anxiety | Sometimes | Exercise, Socializing, Meditation | Work stress impacts my mental health significantly. |
| 6 | 31 | Female | Artist | 7 | None | Often | Therapy, Hobbies, Meditation | Finding balance is key to my mental well-being. |
| 7 | 45 | Male | Accountant | 8 | Depression | Rarely | Socializing, Hobbies, Exercise | Spending time with loved ones helps alleviate stress. |
| 8 | 55 | Female | Doctor | 9 | None | Sometimes | Meditation, Therapy, Exercise | Mindfulness practices have greatly improved my mental health. |
| 9 | 27 | Non-binary | Student | 5 | Anxiety | Often | None | Dealing with anxiety is a daily challenge for me. |
| 10 | 34 | Female | Software Engineer | 8 | None | Rarely | Exercise, Meditation, Hobbies | Regular exercise boosts my mood significantly. |
| 11 | 48 | Male | Chef | 7 | Anxiety | Sometimes | Hobbies, Socializing, Exercise | Cooking helps me relax and unwind after a stressful day. |
| 12 | 36 | Female | Retail | 6 | Depression | Often | Therapy, Meditation, Hobbies | Retail work can be emotionally draining at times. |
| 13 | 40 | Male | Writer | 9 | None | Rarely | Meditation, Socializing | Writing serves as an outlet for my emotions. |
| 14 | 32 | Female | Entrepreneur | 7 | Anxiety | Sometimes | Socializing, Exercise | Entrepreneurship comes with its own set of mental health challenges. |
| 15 | 43 | Male | Architect | 8 | None | Occasionally | Exercise, Meditation, Hobbies | Finding time for hobbies is crucial for my mental well-being. |
Now, let’s proceed with cleaning and coding the sample mental health survey data. Once completed, we can move on to tabulating the data for analysis.
Here’s the result of the table after data cleaning and coding open-ended responses:
| Respondent ID | Age | Gender | Occupation | Overall Well-being | Diagnosed Disorder | Symptoms Frequency | Self-care | Additional Feedback |
|---|---|---|---|---|---|---|---|---|
| 1 | 35 | Female | Teacher | 8 | Anxiety | Often | Exercise, Meditation | Overall, I feel more stressed during the workweek. |
| 2 | 42 | Male | Engineer | 7 | Depression | Sometimes | Therapy, Hobbies | No additional comments. |
| 3 | 28 | Non-binary | Student | 6 | None | Rarely | Socializing, Meditation | I find solace in nature. |
| 4 | 50 | Female | Nurse | 9 | None | Occasionally | Exercise, Therapy, Hobbies | I believe self-care is essential for mental well-being. |
| 5 | 39 | Male | Lawyer | 6 | Anxiety | Sometimes | Exercise, Socializing, Meditation | Work stress impacts my mental health significantly. |
| 6 | 31 | Female | Artist | 7 | None | Often | Therapy, Hobbies, Meditation | Finding balance is key to my mental well-being. |
| 7 | 45 | Male | Accountant | 8 | Depression | Rarely | Socializing, Hobbies, Exercise | Spending time with loved ones helps alleviate stress. |
| 8 | 55 | Female | Doctor | 9 | None | Sometimes | Meditation, Therapy, Exercise | Mindfulness practices have greatly improved my mental health. |
| 9 | 27 | Non-binary | Student | 5 | Anxiety | Often | None | Dealing with anxiety is a daily challenge for me. |
| 10 | 34 | Female | Software Engineer | 8 | None | Rarely | Exercise, Meditation, Hobbies | Regular exercise boosts my mood significantly. |
| 11 | 48 | Male | Chef | 7 | Anxiety | Sometimes | Hobbies, Socializing, Exercise | Cooking helps me relax and unwind after a stressful day. |
| 12 | 36 | Female | Retail | 6 | Depression | Often | Therapy, Meditation, Hobbies | Retail work can be emotionally draining at times. |
| 13 | 40 | Male | Writer | 9 | None | Rarely | Meditation, Socializing | Writing serves as an outlet for my emotions. |
| 14 | 32 | Female | Entrepreneur | 7 | Anxiety | Sometimes | Socializing, Exercise | Entrepreneurship comes with its own set of mental health challenges. |
| 15 | 43 | Male | Architect | 8 | None | Occasionally | Exercise, Meditation, Hobbies | Finding time for hobbies is crucial for my mental well-being. |
This table represents the cleaned data with no errors, inconsistencies, or missing values, and the open-ended responses have been coded into thematic groups for further analysis.
Let’s demonstrate basic tabulation techniques using the provided survey data.
| Overall Well-being | Frequency |
|---|---|
| 5 | 1 |
| 6 | 3 |
| 7 | 4 |
| 8 | 4 |
| 9 | 3 |
This frequency distribution table shows the distribution of overall well-being scores among respondents.
| Overall Well-being | Frequency | Percentage |
|---|---|---|
| 5 | 1 | 6.67% |
| 6 | 3 | 20.00% |
| 7 | 4 | 26.67% |
| 8 | 4 | 26.67% |
| 9 | 3 | 20.00% |
This table displays the frequency distribution of overall well-being scores among respondents, along with the calculated percentage of respondents who chose each option.
| Diagnosed Disorder | Symptoms Frequency | Count |
|---|---|---|
| Anxiety | Rarely | 1 |
| Anxiety | Sometimes | 3 |
| Anxiety | Often | 2 |
| Depression | Rarely | 1 |
| Depression | Sometimes | 2 |
| None | Rarely | 2 |
| None | Occasionally | 2 |
This cross-tabulation table shows the relationship between the diagnosed disorder and symptoms frequency variables, along with the count of respondents falling into each category combination.
| Measure | Value |
|---|---|
| Mean | 7.00 |
| Median | 7.00 |
| Mode | 7 |
| Standard Deviation | 1.195 |
This table presents the descriptive statistics for the overall well-being scores, including the mean, median, mode, and standard deviation.
Apply weighting to your data if your sample doesn’t accurately represent the population demographics. Then, conduct a simple regression analysis to investigate the impact of Mental health quality on overall well-being scores.
Sum of all the original overall well-being scores in the table.
Total Weight = 8 + 7 + 6 + 9 + 6 + 7 + 8 + 9 + 5 + 8 + 7 + 6 + 9 + 7 + 8 = 112
Weighted Score (%) = (Original Score / Total Weight) * 100
For each respondent, Weighted Overall Well-being (%) = (Overall Well-being / Total Weight) * 100
| Respondent ID | Age | Gender | Occupation | Overall Well-being | Weighted Overall Well-being (%) |
|---|---|---|---|---|---|
| 1 | 35 | Female | Teacher | 8 | 7.14 |
| 2 | 42 | Male | Engineer | 7 | 6.25 |
| 3 | 28 | Non-binary | Student | 6 | 5.36 |
| 4 | 50 | Female | Nurse | 9 | 8.04 |
| 5 | 39 | Male | Lawyer | 6 | 5.36 |
| 6 | 31 | Female | Artist | 7 | 6.25 |
| 7 | 45 | Male | Accountant | 8 | 7.14 |
| 8 | 55 | Female | Doctor | 9 | 8.04 |
| 9 | 27 | Non-binary | Student | 5 | 4.46 |
| 10 | 34 | Female | Software Engineer | 8 | 7.14 |
| 11 | 48 | Male | Chef | 7 | 6.25 |
| 12 | 36 | Female | Retail | 6 | 5.36 |
| 13 | 40 | Male | Writer | 9 | 8.04 |
| 14 | 32 | Female | Entrepreneur | 7 | 6.25 |
| 15 | 43 | Male | Architect | 8 | 7.14 |
This table shows the original overall well-being scores and their weighted counterparts for each respondent in the mental health survey data, expressed as a percentage of the total weight.
import pandas as pd
from sklearn.linear_model import LinearRegression
from sklearn.model_selection import train_test_split

# Load the dataset into a pandas DataFrame
data = pd.read_csv('mental_health_survey.csv')

# Assume weights are stored in a column named 'Weight'
weights = data['Weight']

# Select predictors and target variable
predictors = ['Age', 'Gender', 'Occupation', 'Overall Well-being']
target_variable = 'Overall Well-being'

# Apply weighting to the target variable
data[target_variable] = data[target_variable] * weights

# Create a subset of the data with selected variables
selected_data = data[predictors]

# Split data into training and testing sets
X_train, X_test, y_train, y_test = train_test_split(selected_data.drop(columns=[target_variable]),
                                                    selected_data[target_variable],
                                                    test_size=0.2, random_state=42)

# Initialize and fit linear regression model
model = LinearRegression()
model.fit(X_train, y_train)

# Predict using the model
predictions = model.predict(X_test)

# Evaluate model performance
print('R-squared score:', model.score(X_test, y_test))
This snippet outlines a practical exercise where you apply weighting to the data if the sample doesn’t represent population demographics accurately and then conduct a simple regression analysis to investigate the impact of mental health quality on overall well-being scores using Python. Replace 'mental_health_survey.csv' with the actual filename containing your dataset. Adjust the code as needed for your specific dataset and analysis requirements.
Visualization can help make complex data more accessible and engaging.
Let’s visualise the mental health survey data using bar charts, line graphs and Heat Maps.
To visualise the frequency distribution of overall well-being scores, we’ll create a bar chart.
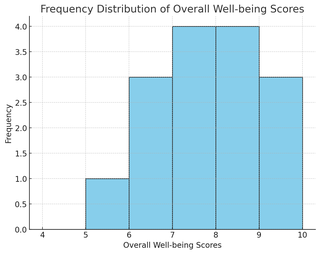
The bar chart illustrates the frequency distribution of overall well-being scores, with scores on the x-axis and the frequency of responses on the y-axis.
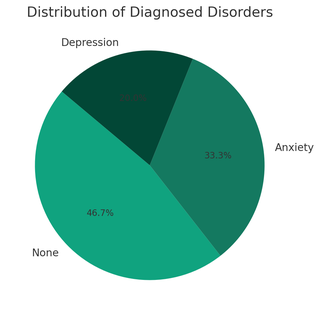
The pie chart illustrates the distribution of diagnosed disorders among respondents, showing the percentage of each disorder.
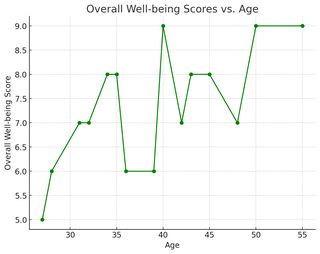
The line graph demonstrates how overall well-being scores vary with respondents’ ages, highlighting the relationship between age and well-being.
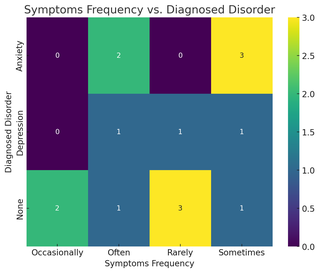
The heatmap visualises the relationship between diagnosed disorders and the frequency of symptoms, providing an aggregated view of how these two variables intersect across the dataset.
The final step is to present your tabulated data in a clear, concise, and meaningful way.

Hear are some key insights and recommendation of our servey:
The findings from this analysis underscore the importance of prioritizing mental health and well-being initiatives. By addressing mental health quality and considering age-related factors, organizations and policymakers can create environments that support individuals in achieving higher levels of overall well-being.
To reinforce your understanding of tabulating survey results, let’s consider a hypothetical survey conducted among students regarding their favorite subjects. The survey includes the following questions:
Using the provided data, create frequency distribution tables for each question and a cross-tabulation table to examine the relationship between gender and favorite subject.
Survey Data:
Gender:
Favorite Subject:
Frequency Distribution Table - Gender:
| Gender | Frequency |
|---|---|
| Male | 45 |
| Female | 55 |
| Other | 5 |
Frequency Distribution Table - Favorite Subject:
| Favorite Subject | Frequency |
|---|---|
| Mathematics | 30 |
| Science | 25 |
| English | 20 |
| History | 15 |
| Other | 10 |
Cross-Tabulation Table - Gender vs. Favorite Subject:
| Mathematics | Science | English | History | Other | Total | |
|---|---|---|---|---|---|---|
| Gender | ||||||
| Male | 20 | 15 | 10 | 5 | 5 | 45 |
| Female | 10 | 10 | 10 | 10 | 15 | 55 |
| Other | 0 | 0 | 0 | 0 | 5 | 5 |
| Total | 30 | 25 | 20 | 15 | 25 | 105 |
You can try advanced tabulation and visualization for this example by your own to have a real hands-on experience. For advanced tabulation and visualization, gather demographic data, apply weighting based on population distributions, conduct multivariate analysis using software like Python’s statsmodels, and visualise the results with appropriate plots.
Tabulating survey results is a critical process in understanding and communicating the insights hidden within your data. By following the steps outlined in this guide and engaging in the practical exercise, you’ll develop the skills needed to effectively analyse and interpret survey data, providing valuable findings for decision-making and research.
This exercise is a simplified scenario meant to practice basic tabulation and analysis techniques. Real-world surveys often involve more complex questions and larger datasets, requiring deeper statistical analysis and interpretation. However, mastering these fundamentals is the first step towards becoming proficient in survey analysis and data interpretation.