Data privacy is a big challenge today. It’s all about what we share and what we don’t. Zoher Karu said it well: “One of the biggest challenges is around data privacy and what is shared versus what is not shared. And my perspective on that is consumers are willing to share if there’s value returned. One-way sharing is not going to fly anymore. So how do we protect and how do we harness that information and become a partner with our consumers rather than just a vendor for them?”
This quote really highlights the importance of effective questionnaires. They’re not just about gathering data – they’re about building trust and delivering value to those who share their information with us. But there’s a catch – the data we collect from these questionnaires needs to be well organised and analysed.
This is where the challenge of non-harmonised data comes in, and it truly can be a problem when you have differently formatted surveys with different questions and scales. The questionnaires might not even be in the same language. Analysing the data straight-up is like trying to complete a jigsaw puzzle where the pieces are from different sets (it’s quite literally impossible). So, we need to get our questionnaires to work in harmony with each other.
In this guide, you’ll discover 10 practical steps – and we’ve thrown in an extra one for good measure – to assist you in the harmonisation of questionnaire data. These data harmonisation steps are designed to make the process smoother, so that your collected data is not just abundant but also rich in insights and meaning.
The first and foremost step in harmonising questionnaires is to define clear objectives. What do you want to achieve with your questionnaire?
Understanding the purpose behind your data collection is key. No matter if it’s gathering customer feedback, conducting market research, or measuring employee satisfaction, your objectives will guide every aspect of your questionnaire design.
Clear goals guarantee that each question serves a specific purpose and contributes to the overall aim of your survey. This focus prevents the inclusion of irrelevant questions and helps maintain the respondents’ engagement – resulting in higher response rates and more accurate data.
(Of course, this step is only possible before collecting the actual data. If you are already dealing with data from different questionnaires that don’t match, you might want to skip to step 6.)
Consistency is key when it comes to questionnaire design. Standardizing question formats across your surveys not only maintains a professional appearance but also enhances the quality of the data collected.
By using a consistent format, you make it easier for respondents to understand and answer the questions, reducing the likelihood of confusion or misinterpretation. This uniformity also facilitates easier data analysis and comparison, especially when dealing with multiple questionnaires over time or across different segments. S
Standardization can include aspects like using the same scale for rating questions (e.g., 1-5), maintaining a consistent order (e.g., always starting with demographic questions), and using a uniform language style. This way your data is reliable, comparable, and easier to interpret, which leads to more accurate insights and informed decision-making.
Designing questionnaires that are scalable across various contexts or projects is essential. Scalability helps make sure that your questionnaire remains relevant and effective, regardless of the scope or size of your project. To achieve this, do the following:
A scalable questionnaire is not just about reaching a larger audience – it’s about maintaining consistency and relevance in diverse scenarios.
A logical sequence of questions is fundamental for keeping respondents engaged and for collecting high-quality data. What do you need to do to achieve a logical flow?
Testing your questionnaire before fully deploying it is a critical step. This process allows you to identify and rectify any issues so that your questionnaire effectively meets its objectives. Here’s how to approach this step:
The goal of testing and revising is not just to fix errors, but to refine your questionnaire to make sure it is as effective and user-friendly as possible.
Now, if it is already too late to tweak the questionnaires and you are feeling stranded with a bunch of data that can’t be analysed together, don’t freak out! We have a solution that fixes this problem in a heartbeat: Our tool Harmony.
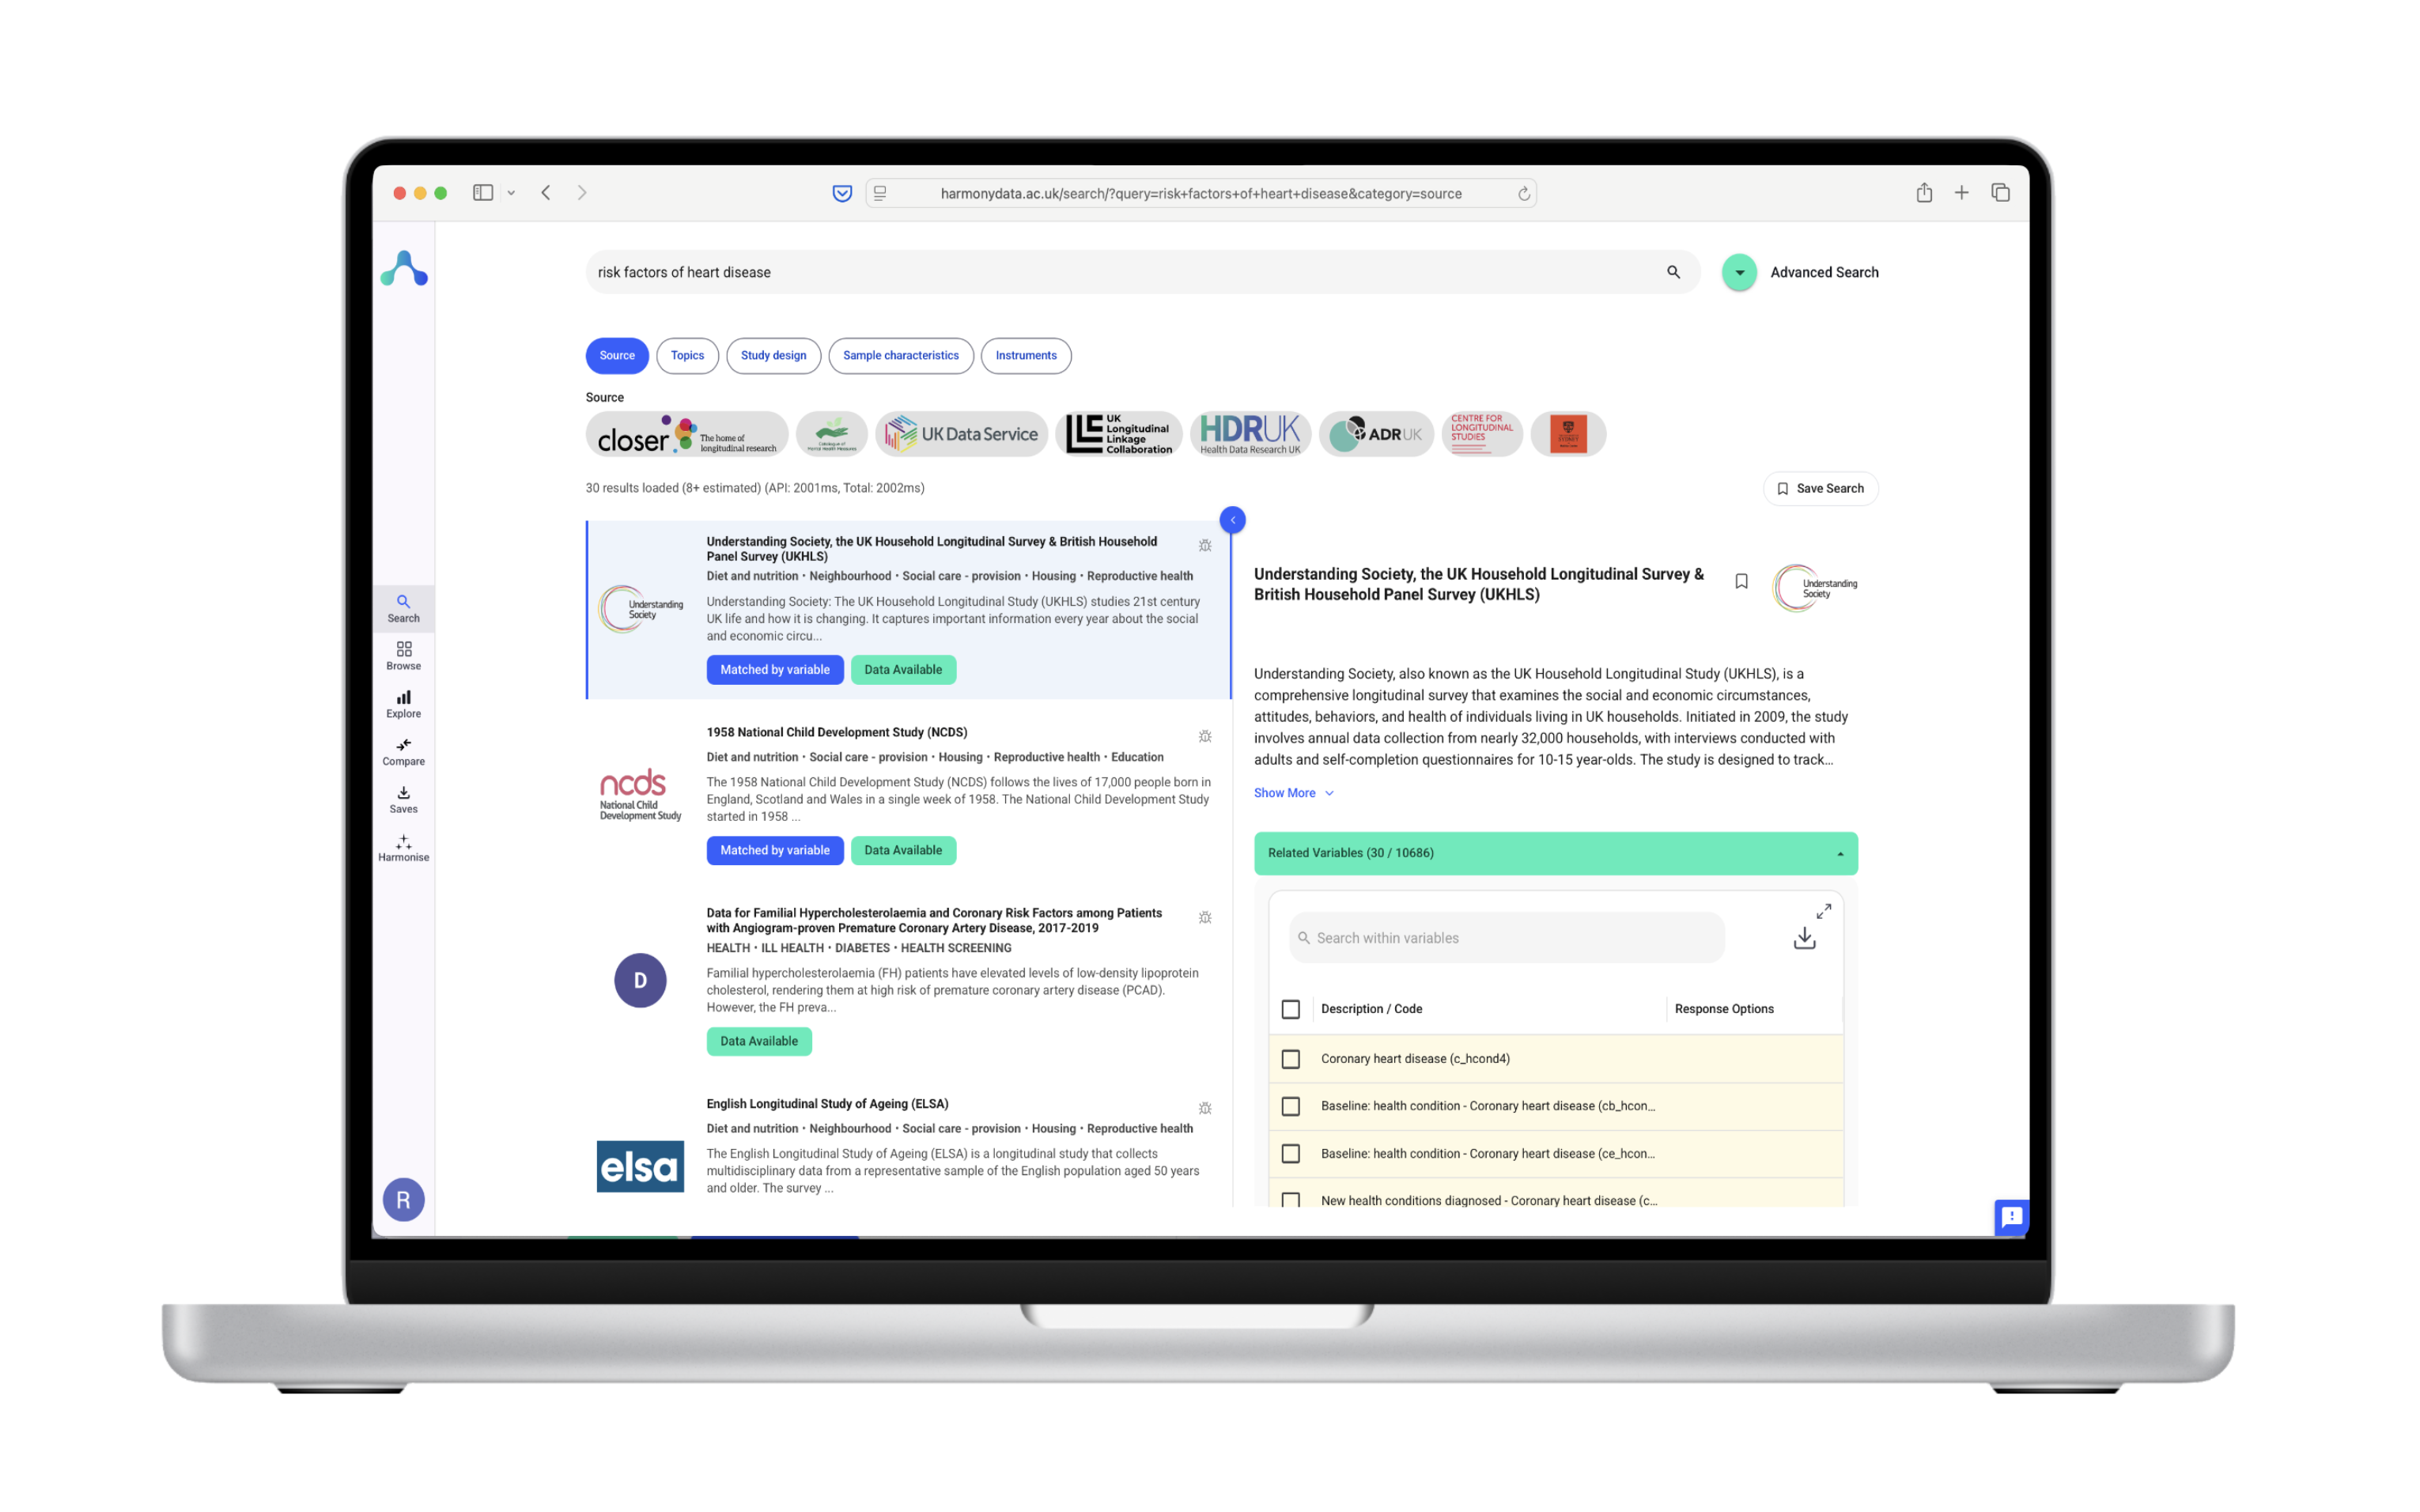
Harmony uses advanced Natural Language Processing (NLP) technologies to assist researchers in the retrospective harmonisation of questionnaire items. It’s a very sophisticated tool that was developed through a collaboration between esteemed institutions such as Ulster University, University College London, and others. It can identify both similarities and differences across a variety of questionnaire items.
Curious about how the data harmonisation process works? Notably, Harmony doesn’t rely on conventional dictionary approaches or word lists. Instead, it utilizes Transformer neural network architectures, which enhance its ability to process and understand the nuances of language in questionnaire contexts.
If this sounds too technical, here’s how it works in real life: For instance, researchers can upload mental health questionnaires in diverse formats like PDF or Excel. Harmony then analyses these questionnaires to determine which questions are identical, similar in meaning, or even antonyms of each other. This facilitates a more nuanced and accurate harmonisation process.
You might have data from different countries all over the world (which is amazing), but now you don’t know how to analyse this data and make sense of it together. After all, what good is all this diverse data if you can’t get the results and answers you need from it?
Harmony can help you out again! One of the unique and groundbreaking capabilities of the data harmonisation tool is its proficiency in multilingual data harmonisation. This feature is particularly vital for global research studies that involve data collection across different linguistic groups. Its smart use of natural language processing means it can work with languages far and wide, which guarantees that every piece of data fits perfectly, no matter where it’s from.
Particularly in mental health research, where the subtleties of language matter, the ability to map datasets from various languages can open doors to new insights into issues like social isolation and anxiety.
So, if you are struggling with the fact that your data is in more than one language, Harmony might be the fastest solution to translate and harmonise your questionnaire data.
So, you have your data but it’s not all in one place, as it should be?
Harmony is able to merge and manage data from a wide array of sources and formats. This feature simplifies the task of aligning data for research purposes. Given the variety of data collection methods and formats used in modern research, it often happens that your data is all over the place.
Why is this important? Researchers often struggle with the task of merging data from different studies, because of the unique formats for questionnaires and data recording for each study or questionnaire (like one being in PDF format and another being an Excel sheet). Harmony eradicates this barrier and enables the smooth fusion of different data sources, which is important if you want to conduct a more thorough analysis.
Next up, let’s talk about comparing questionnaires from different studies. How do you make sense of data from more than one study? You might have guessed it: Harmony has a feature that makes this easy and helpful. This step is great for seeing how your questions stack up against others. It helps you tweak and improve your questionnaire design.
With Harmony, you can look at the small details and differences in the questions used across various studies. This isn’t just about spotting questions that are alike or pretty much the same. It’s also about noticing questions that look similar but actually ask for different things or have opposite meanings. Understanding these differences is important for making sure your questionnaire is asking exactly what you intend and works well across different studies.
This feature is super useful for spotting how certain questions might work (or not work) in different places or among different groups of people. For example, in studies that involve more than one country or community, even small changes in how a question is asked can make a big difference in the answers you get.
So, you’ve tackled all the important parts of harmonising data from your questionnaires…but what if you face a particularly tricky challenge in the future or just feel stuck in a certain area? That’s where Harmony’s community support and expert advice come into play.
Harmony is not just a tool for harmonising questionnaires, but also a platform for collaboration and expert support. Our innovative project brings together a network of expertise from prestigious institutions and organizations.
The collaborative nature of Harmony offers researchers access to a wealth of resources and expert insights. Users of Harmony can benefit from the collective knowledge and experience of these organizations, which can be especially valuable in tackling complex challenges in questionnaire harmonisation.
No matter if your goal is understanding the nuances of language in multilingual questionnaires or if you’re dealing with different cultural contexts in your questionnaire design – the support available through Harmony can be very valuable.
Being part of this collaborative network also means researchers have opportunities to engage with peers, share findings, and discuss best practices. This can lead to further advancements in the field and promote a more standardized approach to questionnaire harmonisation across various research studies.
If you’re interested in learning more about the collaborative nature of Harmony and exploring the tool’s capabilities firsthand, read more about Harmony and its contribution to mental health research.
I know we said there would be 10 practical steps, but here’s a bonus tip: Adopt a mixed-methods approach in your questionnaire harmonisation efforts. This technique involves integrating both quantitative and qualitative data and provides you with a more rounded and thorough understanding of the survey responses.
While quantitative data offers measurable and statistical insights, qualitative data brings in the depth of context and narrative, uncovering nuances that might be overlooked in a purely numeric analysis. This dual approach can significantly enhance the depth and quality of your harmonised questionnaires.
Harmonising data from questionnaires goes beyond just crunching numbers. It’s your gateway to tapping into the true essence of your research. By following these 10 practical steps, plus our bonus tip, you’re well on your way to achieving more accurate, reliable, and valuable insights.
Remember, each step you take toward better data harmonisation brings you closer to deeper understanding and more impactful results.
Ready to take your questionnaire analysis to the next level? Maybe you had to skip the first five data harmonisation techniques because you already have your questionnaire data and need it to be harmonised urgently? That’s even more reason to give Harmony a try and see the difference it makes.
Start harmonising today and turn your data into powerful knowledge. Let’s make data work for you!
Meta Title: Harmonising Questionnaire Data: 10+1 Practical Steps for Enhanced Consistency
Meta Description: Discover expert strategies for questionnaire harmonisation with Harmony. Learn 10+1 practical steps for improved data consistency and analysis.
Keywords:

