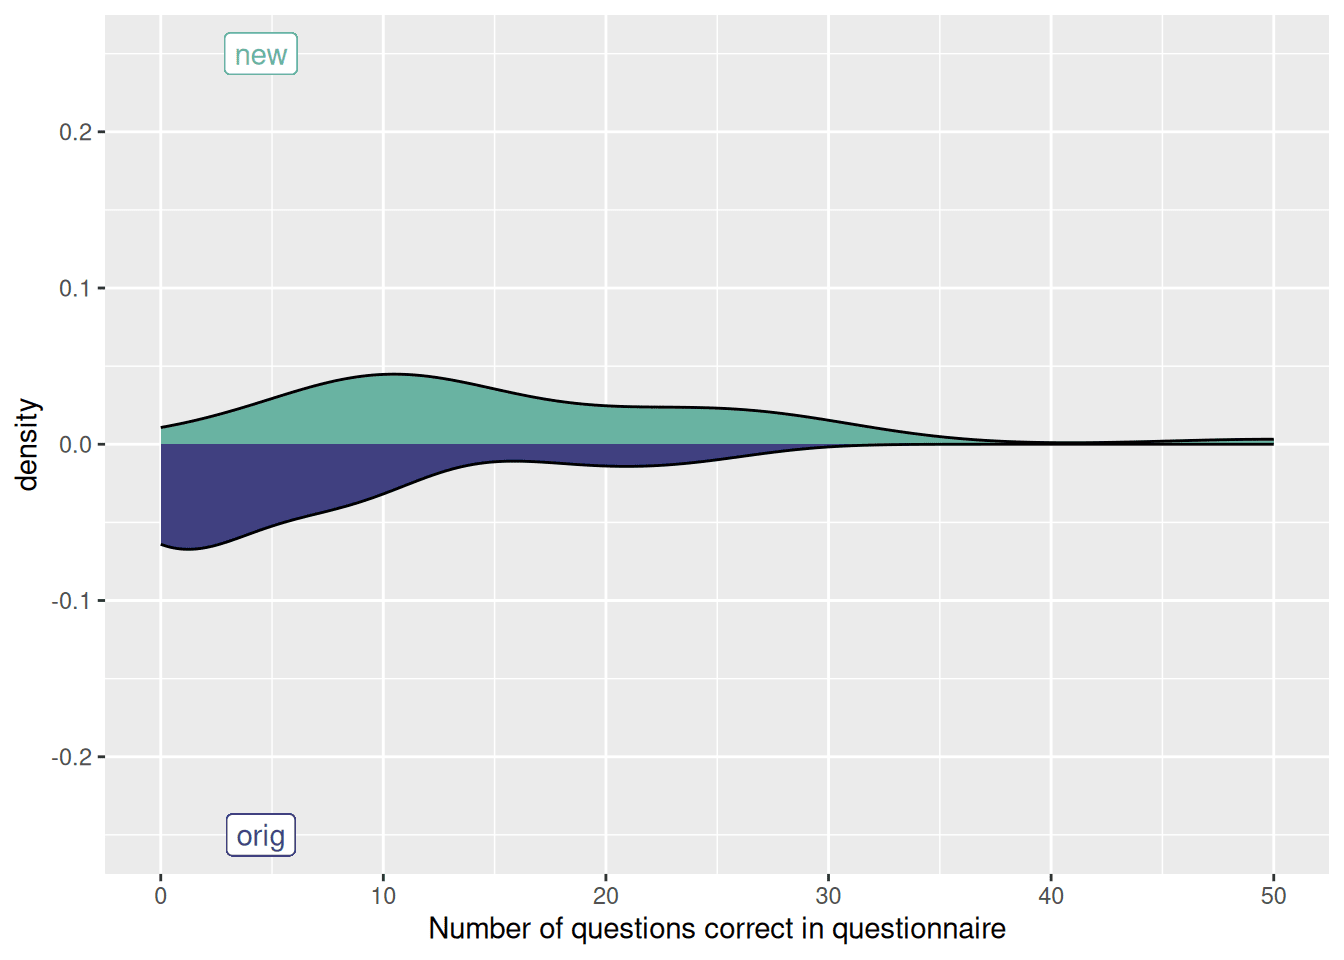
Now more than ever, the international research community are keen to determine whether their findings replicate across different contexts. For instance, if a researcher discovers a potentially important association between two variables, they may wish to see whether this association is present in other populations (e.g. different countries, or different generations). In an ideal world, this would be achieved by conducting follow-up studies that are harmonised by design. In other words, the exact same methodologies and measures would be used in a new sample, in order to determine whether the findings can be replicated. Such direct replication is often challenging however, with research funders often preferring novel lines of inquiry.
As an alternative to direct replication, researchers may choose to reach out to others in the field who either have access to, or are in the process of collecting, comparable data. Indeed many researchers, particularly those in the life and social sciences, routinely make use of large, ongoing studies that collect a variety of data for multiple purposes (e.g. longitudinal population studies). In practice however, much of our research is designed and carried out in silos – with different research groups tackling similar research questions using widely different designs and measures. Even if a researcher is successful in identifying data that are similar to their original work, minor differences in the design or measures may limit the comparability. What are researchers to do in such situations?
One increasingly popular option is retrospective harmonisation. This involves taking existing data from two or more disparate sources, and transforming the data in some way in order to make it directly comparable across sources. Let’s look at a simple, hypothetical example. Say a researcher wants to examine the relationship between level of education and depression, and whether this varies across two datasets, each from a different country. In dataset A, participants were asked to report their highest qualification out of a list of 10 options ranging from “no formal education” to “doctoral education”, whereas in dataset B there was a simple question that asked participants whether they completed a Bachelor’s degree (yes/no). The 10-option question in dataset A could be recoded to match the variable in dataset B, by collapsing all of the categories above and below Bachelor’s level. In many cases, retrospective harmonisation can be applied on an ad-hoc basis, using simple, logical recoding strategies such as this.
However, not all constructs can be measured with such simple, categorical questions. Take the above outcome variable (depression) for instance. Depression is a complex, heterogeneous experience, characterized by a multitude of symptoms that can be experienced to various degrees and in different combinations. In large-scale surveys, depression is typically measured with standardized questionnaires – participants are asked to report on a range of symptoms, their responses are assigned numerical values, and these are summed to form a “total depression score” for each individual. Although this remains the most viable and plausible strategy for measuring something as complex as depression, there is no “gold standard” questionnaire that is universally adopted by researchers. Instead, there are well over 200 established depression scales. In a recent review (McElroy et al., 2020), we noted that the content of these questionnaires can differ markedly, e.g. different symptoms are assessed, or different response options are used.
How can researchers harmonise such complex measures? One option would be to standardize scores within each data set, thus transforming everyone’s raw score to a rank ordering within their given sample. Although straightforward, this approach has a number of weaknesses. First and foremost, you are assuming that both questionnaires are measuring the same underlying construct, and are measuring it equally well. Second, by standardizing a measure within a cohort, you are removing all information about the mean and standard deviation, making it impossible to compare the average level of a construct across datasets.
An alternative approach is to apply retrospective harmonisation at the item-level. Although questionnaires can differ considerably on the number and nature of questions asked, there is often considerable overlap at the semantic/content level. Let’s return to our earlier example of depression. Although there are many different questionnaires that can be used to assess this experience, they often ask the same types of questions. Below is an example of content overlap in two of the most common measures of psychological distress used in children, the Revised Children’s Anxiety and Depression Scale (RCADS), and the Mood and Feelings Questionnaire (MFQ).

By identifying, recoding, and testing the equivalence of subsets of items from different questionnaires (for guidelines see our previous report), researchers can derive harmonised sub-scales that are directly comparable across studies. Our group has previously used this approach to study trends in mental health across different generations (Gondek et al., 2021), and examine how socio-economic deprivation impacted adolescent mental health across different cohorts (McElroy et al., 2022).
One of the main challenges to retrospectively harmonising questionnaire data is identifying the specific items that are comparable across the measures. In the above example, we used expert opinion to match candidate items based on their content, and used psychometric tests to determine how plausible it was to assume that matched items were directly comparable. Although our results were promising, this process was time-consuming, and the reliance on expert opinion introduces an element of human bias – i.e. different experts may disagree on which items match. As such, we are currently working on a project supported by Wellcome, in which we aim to develop an online tool, ‘Hamony’, that uses machine learning to help researchers match items from different questionnaires based on their underlying meaning. Our overall aim is to streamline and add consistency and replicability to the harmonisation process. We plan to test the utility of this tool by using it to harmonise measures of mental health and social connectedness across two cohort of young people from the UK and and Brazil.
Follow this blog for updates on our Harmony project!
References
Costello, E. J., & Angold, A. (1988). Scales to assess child and adolescent depression: checklists, screens, and nets. Journal of the American Academy of Child & Adolescent Psychiatry, 27(6), 726-737.
Chorpita, B. F., Yim, L., Moffitt, C., Umemoto, L. A., & Francis, S. E. (2000). Assessment of symptoms of DSM-IV anxiety and depression in children: A revised child anxiety and depression scale. Behaviour research and therapy, 38(8), 835-855.
Gondek, D., Bann, D., Patalay, P., Goodman, A., McElroy, E., Richards, M., & Ploubidis, G. B. (2022). Psychological distress from early adulthood to early old age: evidence from the 1946, 1958 and 1970 British birth cohorts. Psychological Medicine, 52(8), 1471-1480.
McElroy, E., Villadsen, A., Patalay, P., Goodman, A., Richards, M., Northstone, K., … & Ploubidis, G. B. (2020). Harmonisation and Measurement Properties of Mental Health Measures in Six British Cohorts. CLOSER: London, UK.
McElroy, E., Tibber, M., Fearon, P., Patalay, P., & Ploubidis, G. (accepted, in press). Socioeconomic and sex inequalities in parent-reported adolescent mental ill-health: Time trends in four British birth cohorts. Journal of Child Psychology and Psychiatry

