Did you know that every day, humanity generates 2.5 quintillion bytes of data? That’s like stacking CDs from Earth to Moon twice!
Decisions are increasingly driven by data, which is a big reason why the practice of data harmonisation has become essential in research and the realm of business analytics.
Data harmonisation means combining data from different places to make sure it matches up and can be compared. This is vital for making sense of the huge amounts of data we collect and helps us find clear and important insights.
Today, we’ll answer all your questions about what data harmonisation is and what applications of data harmonisation there are. We’ll also look at some data harmonisation examples that really drive home its importance in achieving accurate conclusions.
You might wonder, “Why is everyone talking about data harmonisation these days?” Simply put, it’s like getting different types of data to sync up and work together in harmony.
Now, you might ask, “Why bother?” To visualize this concept, just imagine inviting guests from around the world to a potluck where everyone brings a dish without coordinating. You might end up with ten versions of potato salad but no main course.
Now, the same thing can happen with data: you gather data from all over the place. More often than not, this data shows up in a mishmash of formats – using different scales, units, or even categories.
This is why you need data harmonisation. It smooths out those rough edges and gets everything onto the same page. This makes the data simpler to compare and use.
We need data! As W. Edwards Deming once said, “Without data, you’re just another person with an opinion.” For both researchers and businesses, harmonised data opens the door to precise insights.
In the world of research, it allows scientists to put various studies or data sets side by side accurately. It helps polish the quality of their findings.
For businesses, it’s like getting a bird’s-eye view of all their information. It aids in smarter decision-making, it helps spot trends, and it reveals (otherwise missed) opportunities.
So, how does data harmonisation actually get the job done?
Data harmonisation is reshaping fields far and wide. It is sparking breakthroughs in both research and the corporate world. Let’s take a look at ten data harmonisation examples in places where it’s making an impact:
The first important data harmonisation example we have to mention are global health insights. By merging health data globally, we see patterns emerge. Diseases don’t recognize borders. Data harmonisation lets us track their spread and shape policies that save lives. How quickly could we respond to the next pandemic with worldwide data at our fingertips?
Data harmonisation peels back the layers of mental health across cultures. It offers a unique window into the many different ways mental health is experienced and reported around the globe.
For example, the Australian Data Archive used Harmony to harmonise survey questions on mental health. This allowed researchers to compare data across studies and time and it revealed trends and cultural impacts on mental health. Such applications of data harmonisation can deeply inform global mental health strategies.
Companies mix data from tweets to receipts and craft marketing that clicks with you. Ever wonder why your feed or “For You”-Page feels like it reads your mind? That’s data harmonisation at work. It helps tailor user experiences as unique as fingerprints.
Pairing old weather records with today’s climate models through data harmonisation offers a peek into our planet’s future. If we could predict the next big environmental shift, how might we better prepare or even prevent it?
Data harmonisation compares global test scores and spotlights winning teaching strategies. You could say it’s like finding the secret recipe for educational success. Imagine a world where every classroom benefits from the best teaching methods that were discovered from around the globe.
By blending market insights, companies get a 360-view of what consumers want before they do. It’s like a look into the future of consumer desires. Could this be the end of products nobody asked for and failed product launches?
Harmonising data across cultures sheds light on the fabric of society. This could bring us all closer to policies that truly understand the global citizen.
Data harmonisation in clinical trials is able to speed up medication’s journey to those in need. It can lead to medical breakthroughs and save many lives. Imagine the future of healthcare, where waiting years for vital treatments becomes a part of the past.
Businesses that are improving supply chains with data harmonisation make sure everything works together perfectly. The result? Products flow smoothly, costs shrink, and customers smile. Could this be the secret to the ultimate customer satisfaction?
Conservationists rely on harmonised data to understand and protect our planet’s biodiversity. Each set of data contributes to a larger understanding of the environment. What new insights can we gain about Earth from this information?
Why do we care so much about data harmonisation? Because asking datasets to “get along” without it is like trying to organise a choir where every singer is performing a different song. Harmony brings them into tune – with our tool, you can create a symphony from all the disordered noise.
Harmony is especially helpful when it comes to organising survey data. It leverages the smarts of Natural Language Processing (NLP) tech to ace the job of looking back and lining up questionnaire items.
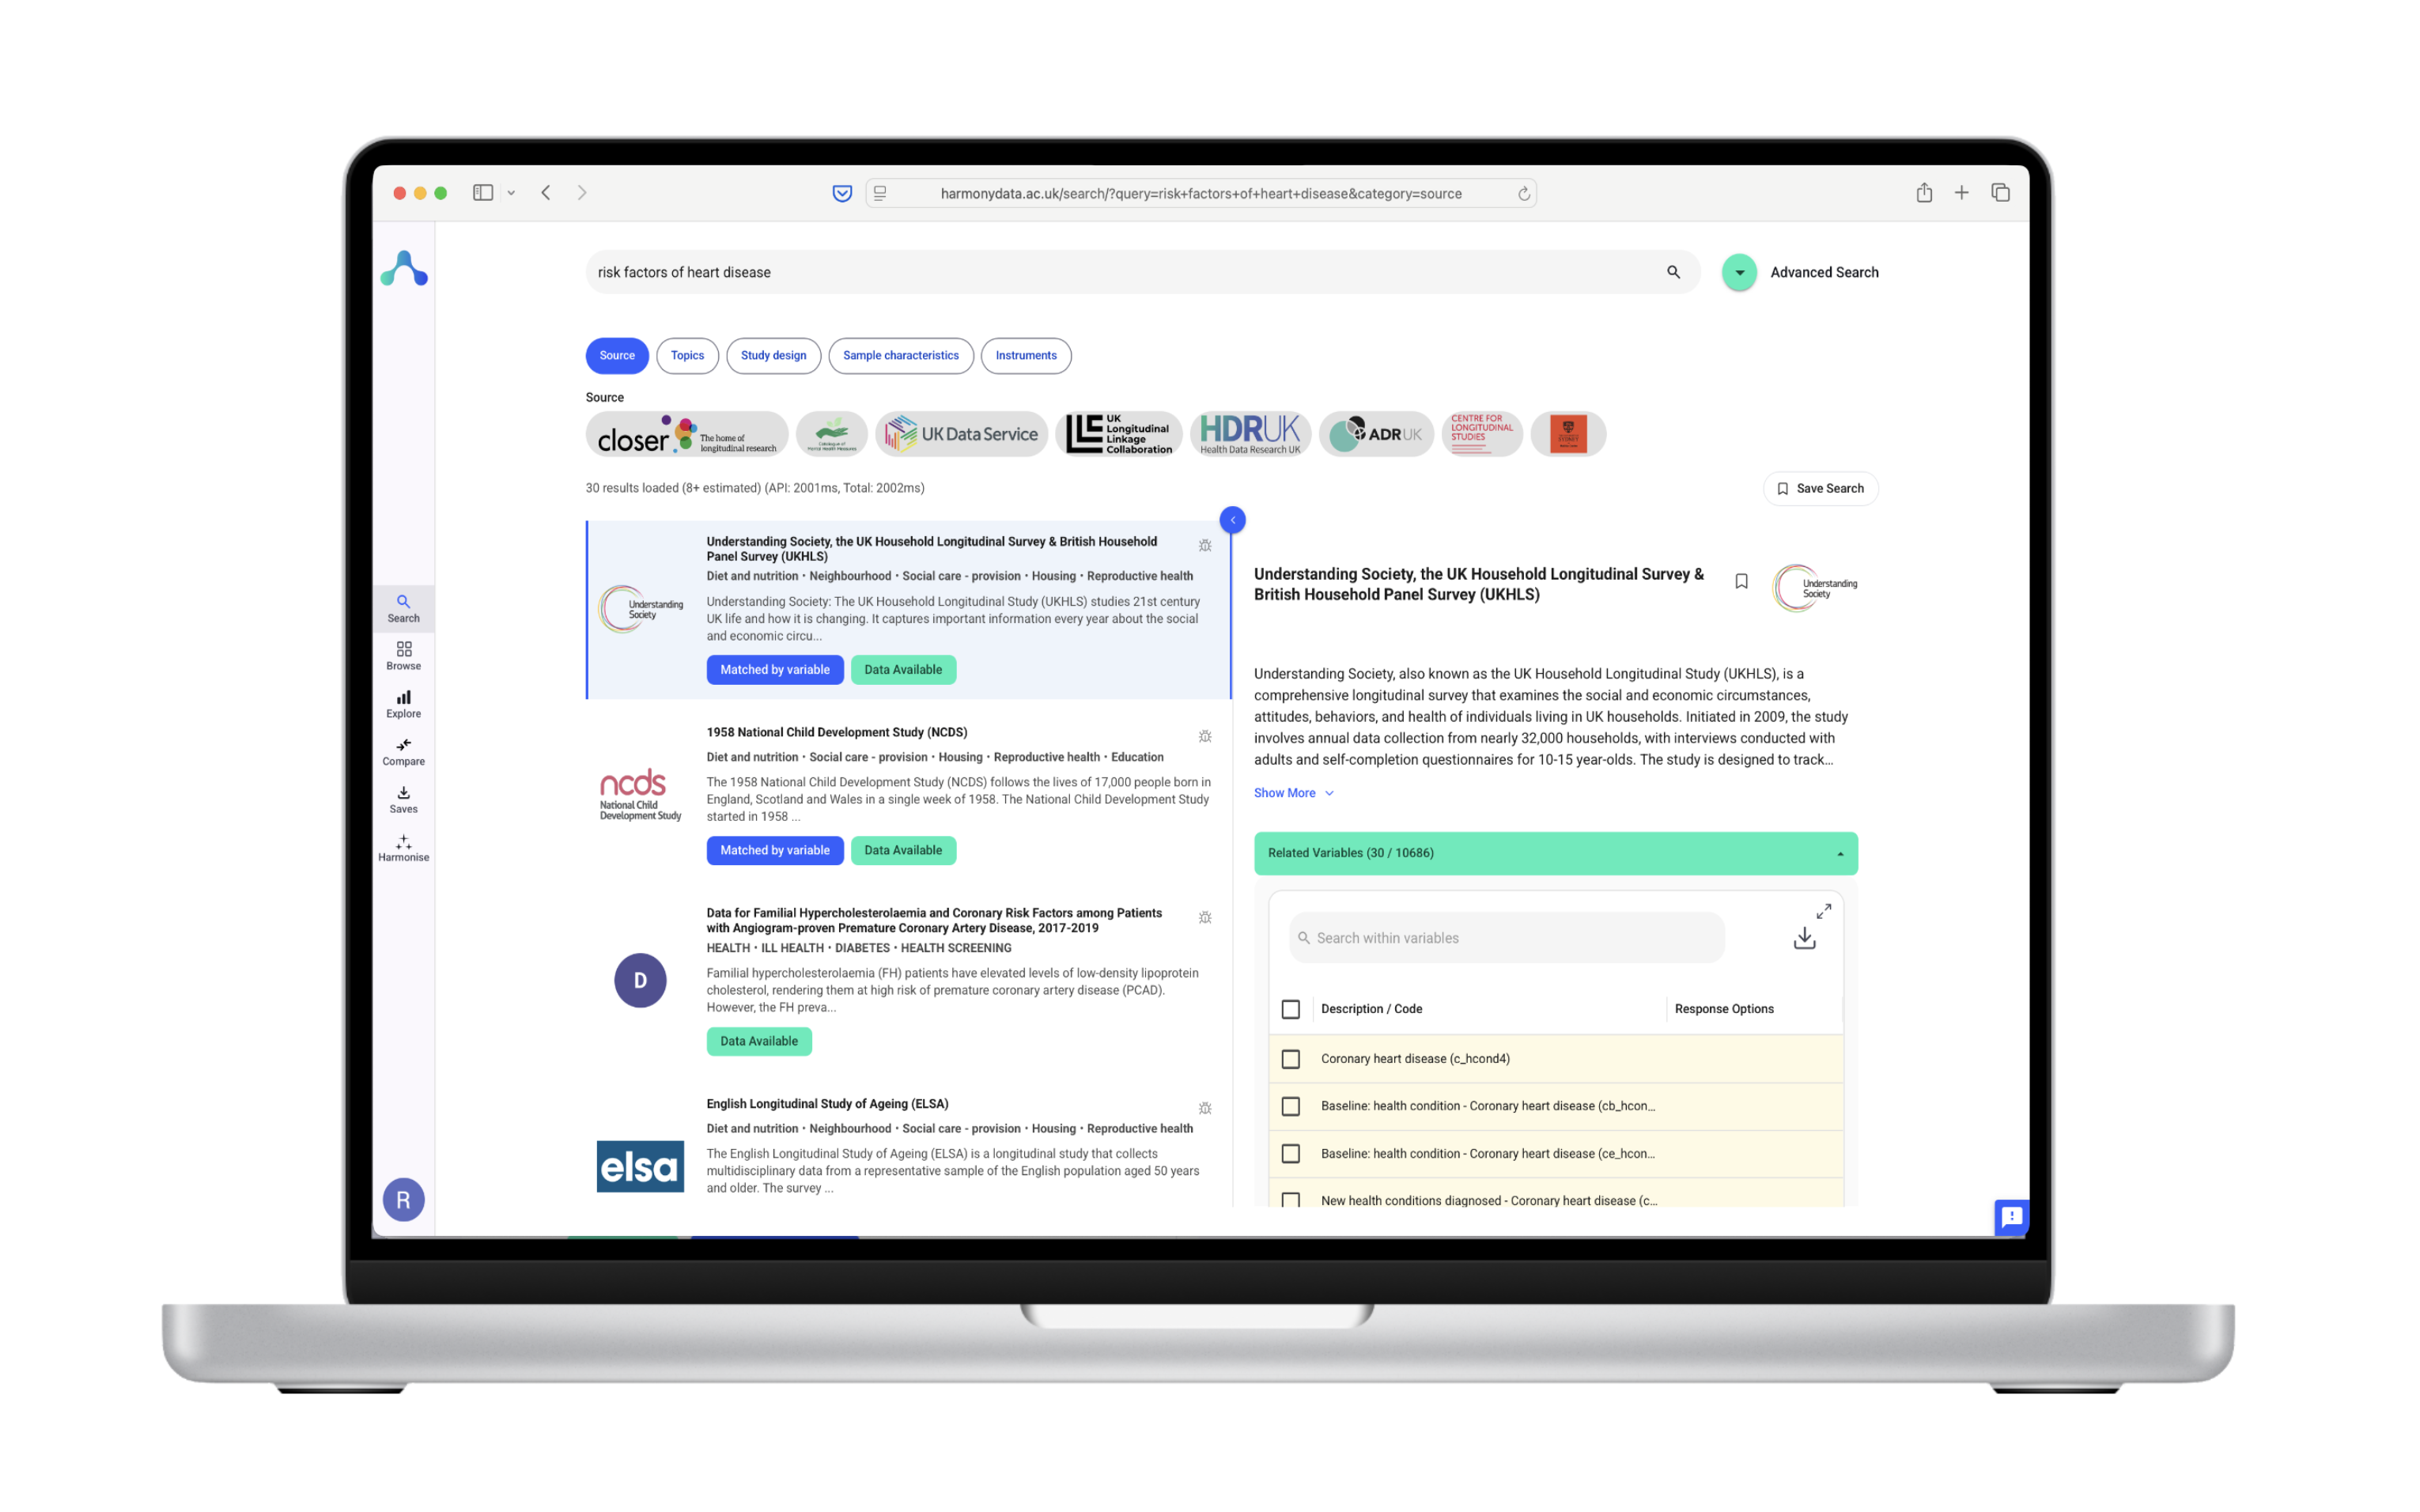
Harmony also makes life easier by letting researchers upload surveys in all sorts of formats, like PDFs or Excel files. It then gets down to business, sorts out which questions are alike, which are different, or even opposites, and then it draws up a network graph to show how everything connects.
This not only helps in getting datasets to match up but also opens the door to new discoveries on big issues, such as social isolation and anxiety – by offering a clear way to see if different datasets are really talking about the same thing.
Think of Harmony as your go-to assistant for making sense of diverse questionnaire data. It’s crafted to make the job of data harmonisation smoother. It focuses on looking back at questionnaire items to find their best match across various studies. It can also help navigate through different language versions with ease.
A wide array of professionals and people from different walks of life finds value in data harmonisation:
The Harmony Project is a community-driven initiative that flourishes with collective input. From fostering corporate sponsorships to enriching your own research publications, Harmony invites you to be a part of something that extends well beyond the conventional — where each contribution can lead to mutual growth and groundbreaking discoveries.
Starting to use Harmony is as simple as a few clicks and commands. Here’s how you can do it:
In the world of big data, up to 73% of data within an enterprise goes unused for analytics. Data harmonisation with Harmony could turn this dormant data into active insights.
We’re extending an open invitation to researchers, change-makers, and business leaders alike to join Harmony. If you would like to elevate your research, chip in on the evolution of this top-notch tool, or tap into Harmony for your business insights, the time to jump in is now.
Come join us in sculpting the future of data harmonisation. Unlock the vast potential of data to spark innovation and make new discoveries!
Ready to dig deeper into what Harmony can do? Enhance your understanding and get more ideas for applications of data harmonisation through these insightful blog posts:
Explore further resources for broader context, such as Natural Language Processing and various studies and achievements related to data science in mental health at Fast Data Science.
Meta Title: Unlock Data Harmonisation with Harmony: Transform Your Research & Analysis
Meta Description: Explore Harmony for seamless data harmonisation. Dive into our guide on using this tool to enhance research, attract collaborations, and drive insights.
Keywords:

