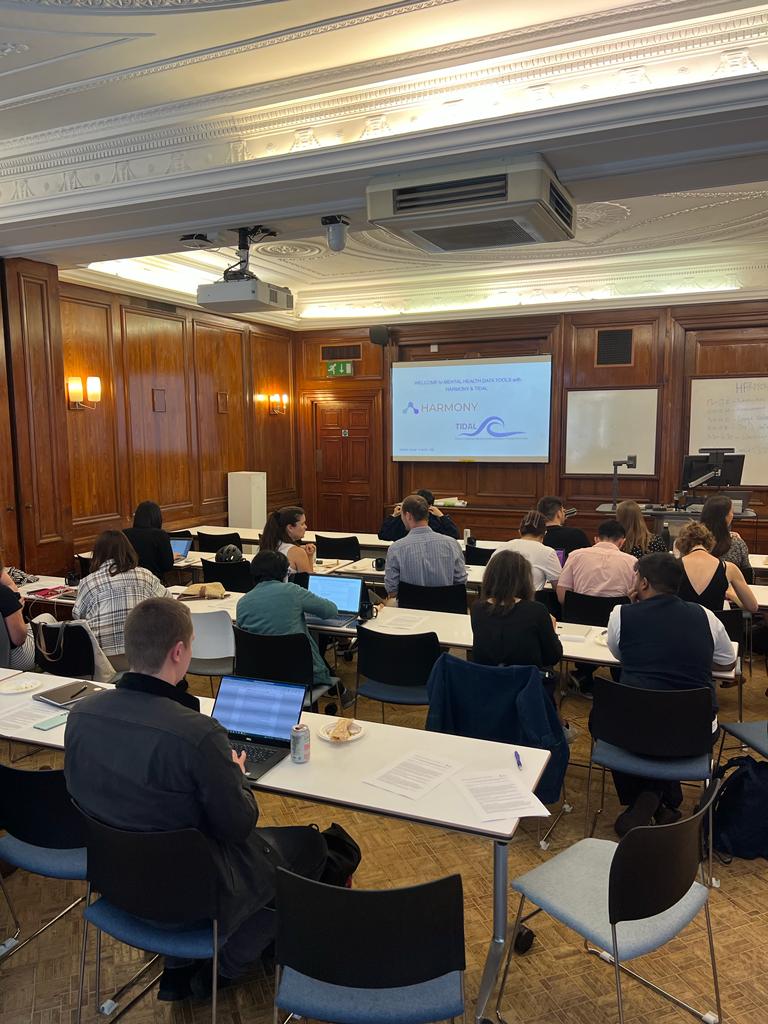
On Thursday, August 17th, 2023, the Harmony and TIDAL teams teamed up to run a workshop at University College London to allow researchers to try out their software tools. The workshop was attended by researchers interested in using these tools to study child and adolescent mental health, and other areas in social science research, from the effects of gambling addiction to asking questions about nature vs nurture in twin studies.
You can read more about the event on the Centre for Longitudinal Studies’ website.

The aim of the workshop was to give participants hands-on experience with Harmony and TIDAL, and to demonstrate how they can be used to answer research questions about mental health, covering the following topics.
The participants were given the opportunity to practice using Harmony and TIDAL on a simulated dataset. They also had the chance to ask questions and get help from the Harmony and TIDAL teams.
The data used in the workshop was synthetic data that had been simulated based on the following two UK cohort studies:
The ALSPAC is a study of over 14,000 children who were born during the early 1990s from the Avon region in England. The BCS70 is a study of around 17,000 people born in England, Scotland, and Wales in a single week of 1970.
Both cohorts administered similar (but not identical) questionnaires to study mothers at various points as their children were growing up. In BCS70, the Rutter parent behaviour questionnaire was administered, whereas in ALSPAC, the Rutter scale was administered initially, but the Strengths and Difficulties Questionnaire (SDQ) was used from the age 7 assessment onwards. In both cohorts, there were ages where the administration of these questionnaires overlapped, particularly ages 5 and 10.
The synthetic data was created to mimic the real data from these two cohorts. It was created using a statistical method called bootstrapping. Bootstrapping involves repeatedly sampling data from the real data and then using the sampled data to create a new dataset. This process is repeated many times to create a large number of simulated datasets.
After becoming familiar with both Harmony and TIDAL, participants were able to use both Harmony and TIDAL to harmonise the Rutter and SDQ items within ALSPAC, to create trajectories of total difficulties/problems. We collected participants’ manually harmonised items and plan to compare these with Harmony’s cosine scoring to understand how well Harmony performs compared to human experts.
The workshop was a great success and participants learned a lot about how to use these powerful tools. We’ve also gathered a great deal of user testing experience on both these tools. If you are interested in using Harmony or TIDAL to study child and adolescent mental health, please visit harmonydata.ac.uk and the TIDAL repo and the TIDAL app for more information.
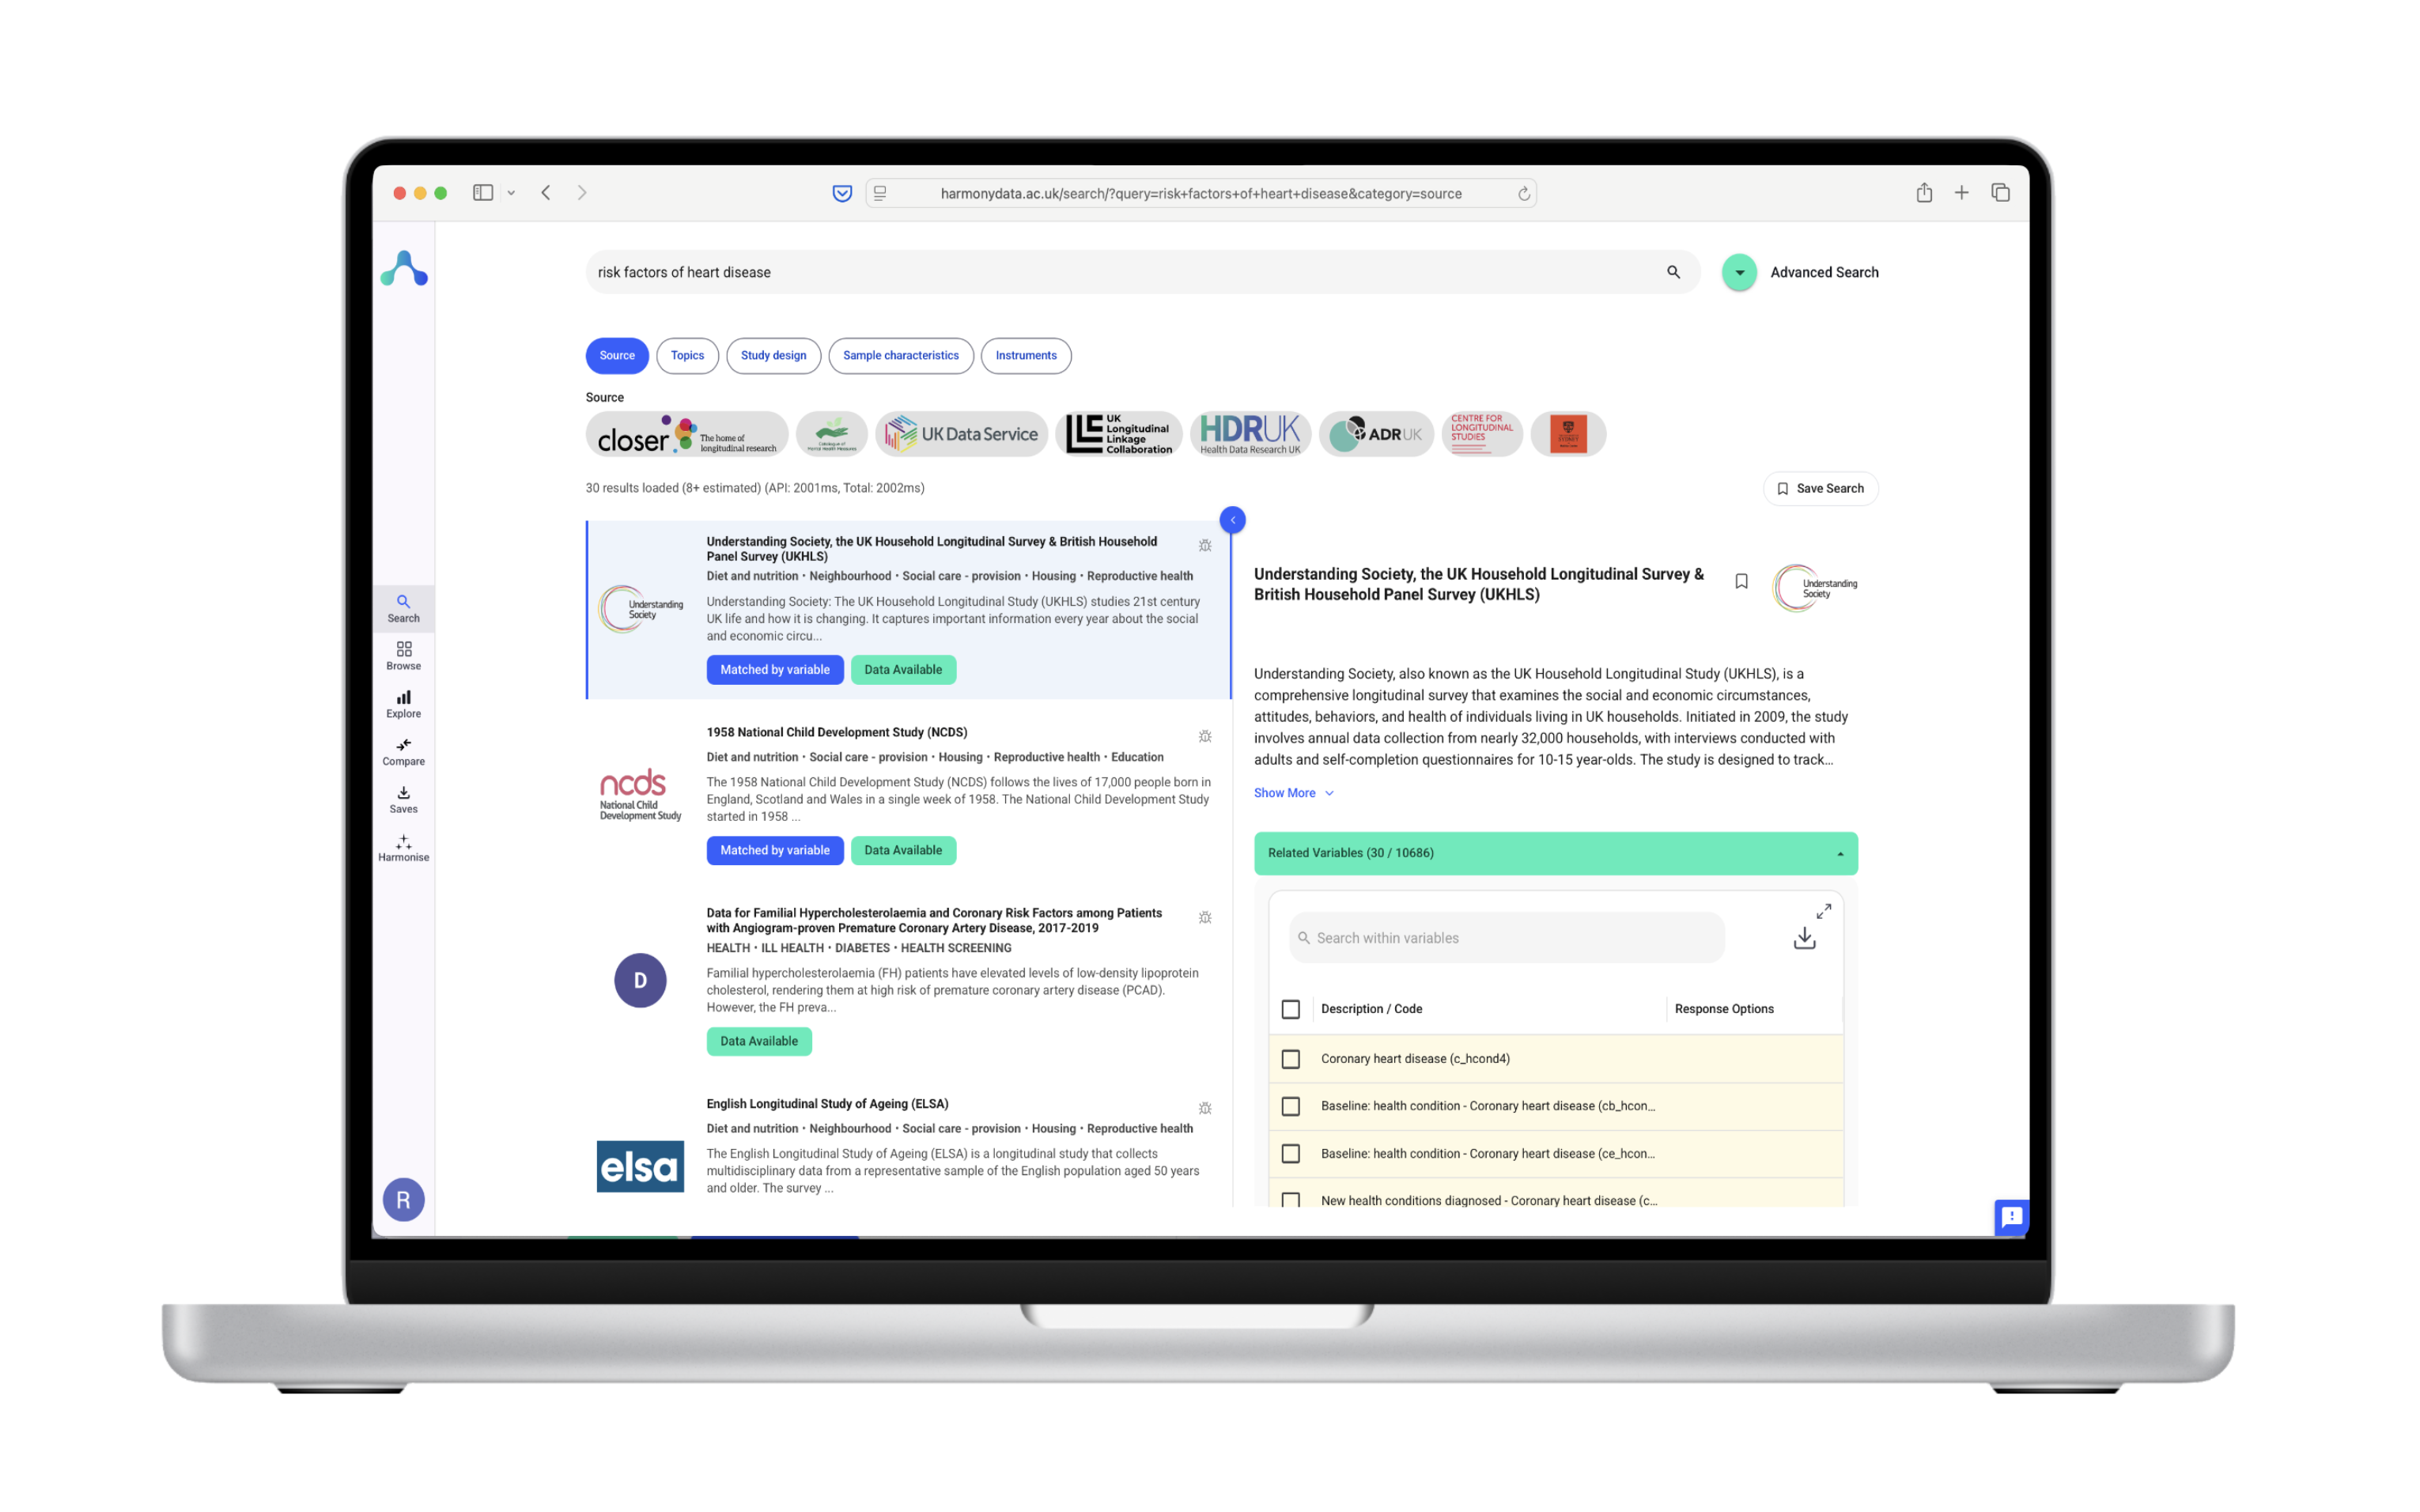
Harmony is a software tool using natural language processing and Transformer models (LLMs) that can be used to harmonise questionnaires and create comparable measures of mental health symptoms. It is a valuable tool for researchers who want to study mental health across different populations and settings.
Harmony uses natural language processing to identify and match items across questionnaires. This process is more accurate and efficient than traditional methods of harmonisation. Harmony also provides a number of features that make it easy to use, such as a user-friendly interface, responsive design, and Python and R bindings and REST API.
If you are interested in learning more about Harmony, please check out some of our videos and blog posts.
TIDAL stands for Tool to Implement Developmental Analyses of Longitudinal Data. TIDAL is designed to facilitate work trajectories and remove barriers to implementing longitudinal research to researchers without specialist statistical backgrounds, enabling them to address questions like:

